

Abstract
The anterior cingulate cortex (ACC) and dorsolateral prefrontal cortices (DLPFC) share robust excitatory connections. However, during rapid eye movement (REM) sleep, when cortical activity is dominated by acetylcholine, the ACC is activated but DLPFC is suppressed. Using pathway tracing and electron microscopy in nonhuman primates (Macaca mulatta), we tested the hypothesis that the opposite states may reflect specific modulation by acetylcholine through strategic synaptic localization of muscarinic m2 receptors, which inhibit neurotransmitter release presynaptically, but are thought to be excitatory postsynaptically. In the ACC pathway to DLPFC (area 32 to area 9), m2 receptors predominated in ACC axon terminals and in more than half of the targeted dendrites of presumed inhibitory neurons, suggesting inhibitory cholinergic influence. In contrast, in a pathway linking the DLPFC area 46 to DLPFC area 9, postsynaptic m2 receptors predominated in targeted spines of presumed excitatory neurons, consistent with their mutual activation in working memory. These novel findings suggest that presynaptic and postsynaptic specificity of m2 cholinergic receptors may help explain the differential engagement of ACC and DLPFC areas in REM sleep for memory consolidation and synergism in awake states for cognitive control.
Introduction
The anterior cingulate cortex (ACC) and dorsolateral prefrontal cortices (DLPFC) are robustly linked but have distinct roles in cognitive control (for review, see Barbas et al., 2002; Rushworth et al., 2011). The two regions also differ markedly in their physiologic state during rapid eye movement (REM) sleep: after a period of silence, the ACC is reactivated, whereas the DLPFC remains suppressed (for review, see Muzur et al., 2002). The question arises about the circuit mechanism for the opposite activation pattern, in view of the massive excitatory glutamatergic projections from ACC (area 32) that innervate widely the DLPFC (Barbas et al., 1999). We previously found that ACC axons form large synapses with a subset of inhibitory neurons in DLPFC, accounting for ∼20–30% of all synapses in the pathway (Medalla and Barbas, 2009, 2010). However, this ACC pathway innervates mostly calbindin inhibitory neurons, which form synapses with distal dendrites of adjacent excitatory (pyramidal) neurons, eliciting weak inhibition (for review, see DeFelipe, 1997). This type of inhibition is optimally suited to reduce noise in DLPFC during cognitive operations that require attention (Wang et al., 2004b). However, even if recruited during REM sleep, it is unlikely that this limited ACC-mediated inhibition can silence DLPFC activity.
A more likely possibility is that the opposite states in ACC and DLPFC are mediated through the cholinergic neuromodulatory system, which is highly active during REM sleep (for review, see Kahn and Hobson, 2005; Walker et al., 2005). Acetylcholine binds to two main classes of receptors in the cortex, nicotinic and muscarinic. Muscarinic receptors, specifically the m1 subtype, are the predominant cholinergic receptors in the cortex. Activation of m1 receptors has primarily depolarizing effects on pyramidal neurons, in which they are mostly localized postsynaptically on spines (for review, see McCormick, 1989; Levey, 1996). Cholinergic projections innervate the ACC in all layers and are considerably denser than in DLPFC (Mesulam et al., 1984; Lewis, 1991; Ghashghaei and Barbas, 2001), a pattern that may explain the differences in activation in the two regions during REM sleep. However, this scenario does not explain why, once activated, the massive excitatory projections from ACC do not then activate excitatory postsynaptic sites in DLPFC.
Acetylcholine also has suppressive effects in the cortex, mediated through stimulation of presynaptic muscarinic receptors that decrease release of excitatory neurotransmitter (for review, see Lucas-Meunier et al., 2003; Hasselmo, 2006) or through postsynaptic activation of inhibitory neurons (McCormick and Prince, 1985; Pitler and Alger, 1992; Kawaguchi, 1997; McQuiston and Madison, 1999). Among the diverse cholinergic receptors, the muscarinic m2 subtype is found mostly at presynaptic boutons of cortical glutamatergic axons and also at postsynaptic sites of a subset of GABAergic neurons (Levey et al., 1991; Mrzljak et al., 1993; Erisir et al., 2001). We reasoned that m2 receptors in the ACC pathway may enhance suppression in DLPFC, by dual mechanisms: through presynaptic m2 receptors on ACC boutons that form synapses in DLPFC and through postsynaptic m2 receptors on dendrites of targeted inhibitory neurons in DLPFC. We provide evidence consistent with this hypothesis.
Materials and Methods
Surgical procedures and injection of neural tracers
Injections of neural tracers were made in normal rhesus monkeys (Macaca mulatta; 2–3 years of age of both sexes; n = 3; two females, one male; five injection sites), using MRI, surgical, and tissue processing procedures described previously (Medalla et al., 2007; Medalla and Barbas, 2009). Animals were obtained from the New England Primate Research Center (NEPRC), and protocols were approved by the Institutional Animal Care and Use Committee at NEPRC, Harvard Medical School, and Boston University in accordance with the NIH Guide for the Care and Use of Laboratory Animals. Procedures were designed to minimize animal suffering and reduce the number of animals used.
Injection sites were based on stereotaxic coordinates calculated from MRI scans taken before surgery, using the midline and betadine-filled ear-bar tips as reference points. We injected the bidirectional tracers biotinylated dextran amine (BDA), fluoroemerald (FE; dextran fluorescein), fluororuby (FR; dextran tetramethylrhodamine), or lucifer yellow (LY; dextran lucifer yellow; Invitrogen) using a microsyringe (5 or 10 μl; Hamilton) mounted on a microdrive. All tracers were dextran amines of 10 kDa molecular weight optimized for anterograde transport to label the entire extent of axons and terminals (boutons) (Dolleman-Van der Weel et al., 1994). They also label neurons retrogradely, but labeling is sporadic and restricted to the cell bodies and proximal dendrites and does not appear to enter axon collaterals (Veenman et al., 1992; Reiner et al., 2000; our personal observations). In each case, the dye was diluted to 10 mg/ml in distilled water and delivered in two to four penetrations (spaced 0.5 mm apart; 2 μl of dye per penetration) at a depth of 1.2–1.6 mm below the pial surface. The tracer injection sites in prefrontal areas 46 and 32 (Fig. 1) are summarized as follows: tracer injections in area 46, case BIr (female, 3 years old, left hemisphere, FR) and case BH (female, 3 years old, left hemisphere, BDA); tracer injections in area 32, case BI (female, 3 years old, right hemisphere, BDA), case BIe (female, 3 years old, right hemisphere, FE), and case BLy (male, 3 years old, right hemisphere, LY).
Perfusion and tissue processing
After a survival period of 18 d, the animals were given an overdose of sodium pentobarbital (>50 mg/kg) until a deep level of anesthesia was achieved and then transcardially perfused with freshly depolymerized 4% paraformaldehyde and 0.2% glutaraldehyde (EM grade; Ladd Research Industries) in 0.1 m phosphate buffer (PB) with 0.9% NaCl, pH 7.4, at 37°C. The brains were removed from the skull, cryoprotected in graded solutions of sucrose (10–30%), frozen in −70°C isopentane (Rosene et al., 1986), and cut on a freezing microtome in the coronal plane at 50 μm. To preserve the ultrastructure, tissue was stored in anti-freeze solution (30% ethylene glycol, 30% glycerol, in 0.05 m PB, pH 7.4 with 0.05% azide) at −20°C until use.
Single and double immunohistochemical labeling for bright-field microscopy.
To view and map tracer-labeled fibers and m2 receptors at the light microscope, we used immunohistochemical techniques using the avidin–biotin (AB) with horseradish peroxidase (HRP) method as described previously (Medalla and Barbas, 2010). Free-floating sections were rinsed in 0.01 m PBS, incubated in 0.05 m glycine (1 h, 4°C), and blocked in 5% normal goat serum (NGS) and 5% bovine serum albumin (BSA) with 0.2% Triton X-100 (1 h, 25°C). For cases with BDA injections, sections were incubated for 1 h in AB–HRP solution (1:100 in PBS with 0.1% Triton X-100; Vectastain PK-6100 ABC Elite kit; Vector Laboratories), rinsed, and then processed using the peroxidase-catalyzed polymerization of diaminobenzidine (DAB substrate kit, 2–3 min; Vector Laboratories). For cases with fluorescent tracers FE, FR, and LY, sections were processed for immunohistochemistry using antibodies against the fluorophores to view label at the light microscope. Sections were first incubated in AB blocking reagent (AB blocking kit; Vector Laboratories) to prevent cross-reaction with BDA, blocked in serum (as above), and then incubated overnight (4°C) in the rabbit polyclonal primary antibodies against FE (anti-fluorescein/Oregon Green), FR (anti-tetramethylrhodamine), or LY (anti-lucifer yellow; 1:800; Invitrogen). Sections were then incubated for 2 h in biotinylated secondary goat anti-rabbit IgG (1:200; Vector Laboratories), followed by 1 h in AB–HRP solution, and then processed for DAB.
To label m2 receptors, sections were incubated overnight in a rat monoclonal antibody against the i3 loop of the muscarinic acetylcholine m2 receptor subtype fusion protein (1:500, 4°C; clone M2-2-B3; Millipore), as described previously (Mrzljak et al., 1993; Levey et al., 1995). After rinsing, sections were incubated for 2 h in biotinylated goat anti-rat IgG (1:200; Vector Laboratories) and then 1 h in AB–HRP solution, followed by DAB processing. We also used double-labeling techniques for bright-field microscopy to visualize m2 receptor label along with neural tracers using two precipitation methods that yield distinct reaction products. Sections were first processed for tracers with DAB (as above) and then incubated in AB block and serum blocking solution (as above) to prevent cross-reaction with the subsequent labeling of m2 receptors. Sections were then incubated in the primary antibody against m2, followed by biotinylated goat anti-rat IgG and then AB–HRP, as described above. Sections were then processed using the SG substrate kit (2–3 min; Vector Laboratories), which precipitates into a blue–gray reaction product, discernible from the brown DAB reaction product (Fig. 1D,E).
Double immunohistochemical labeling for fluorescence microscopy.
To assess the extent of colocalization of tracer and m2 receptors in prefrontal axons, we used secondary antibodies conjugated to red (Alexa Fluor 568) or green (Alexa Fluor 488) fluorescent probes. Sections were treated with glycine, blocked with serum, and incubated in primary antibody against m2 (as above). To view BDA label together with m2 receptors under fluorescence, sections were coincubated overnight in fluorescent-conjugated streptavidin and secondary goat anti-rat IgG (1:200; Invitrogen) of complementary colors. In cases with FE or FR fluorescent tracers, m2 was labeled with the complementary fluorescent probe. In some sections, tracer signal was enhanced using anti-FE or anti-FR primary antibodies (as above) with the color-matched fluorescent-conjugated secondary anti-rabbit IgG (1:200, Alexa Fluor 488 for FE, Alexa Fluor 568 for FR; Invitrogen).
After processing, sections were mounted, dried, and coverslipped with Entellan (EMD Chemicals) for sections processed for light microscopy and Krystalon (EMD Chemicals) or Prolong anti-fade (Invitrogen) for sections processed for fluorescence microscopy. Adjacent sections were counterstained with thionin (Sigma) to delineate areas and layers.
Double preembedding immunohistochemistry for electron microscopy.
For viewing prefrontal pathways labeled with tracers and m2 receptors at the electron microscope (EM), we used dual preembedding immunohistochemistry using DAB staining and gold-conjugated secondary antibodies. Sections were processed as above but with lower (0.025%) Triton X-100 for all steps. Sections were incubated overnight in the appropriate combination of primary antibodies (1:500 rat anti-m2 for BDA tissue; 1:500 rat anti-m2 with 1:800 rabbit anti-FE, FR, or LY). Sections with FE, FR, or LY label were incubated in secondary biotinylated goat anti-rabbit IgG (as above). After rinses in PBS, sections were incubated in gold-conjugated secondary goat anti-rat IgG (1:50, overnight at 4°C, particle diameter of 5 nm; Ted Pella) or FAB fragment (1:200 for 3 h at 25°C, particle diameter of 1.4 nm; Nanoprobes) diluted in PBS with 1% NGS, 1% BSA-c (acetylated BSA; Aurion), and 0.1% gelatin. The sections were rinsed quickly in PBS, postfixed in 2% glutaraldehyde (5 min, 25°C), followed by rinses in glycine (5 min), water (2 min), and 0.02 m sodium citrate buffer, pH 7 (2 × 5 min). Gold labeling was then intensified with a silver enhancement kit (IntenSE M kit, GE Healthcare; or HQ Silver enhancement kit, Nanoprobes) using optimal incubation times (6–12 min) to yield silver-enhanced gold particles of larger than 15 nm. Sections were rinsed in sodium citrate buffer (5 min) and then in 0.1 m PB (3 × 5 min). Sections were incubated in AB–HRP (in 0.1 m PB) and processed for DAB to visualize the tracers (as above). The sections were fixed in 6% glutaraldehyde with 2% paraformaldehyde using a variable wattage microwave (150 W at 20°C, 3–5 × 2 min; Ted Pella) until sample temperature reached >30°C. Small pieces of tissue with label were cut, rinsed thoroughly in PB, postfixed in osmium, dehydrated in increasing concentrations of ethanol (50–100%), stained with 1% uranyl acetate (EM Sciences), infiltrated with propylene oxide, and flat embedded in Araldite resin (Earnest F. Fullam), as described previously (Medalla et al., 2007).
Labeling pattern of m2 receptors was similar across all counterbalancing methods using matched tissue sections processed with fluorescent probes, DAB, SG substrate, and silver-enhanced gold for bright-field, confocal, and electron microscopy. In some EM tissue sections using the GE Healthcare reagents, the order of precipitation methods was reversed, and the results were consistent. In control experiments, in which primary antibodies were omitted and the AB blocking kit was used before AB binding, no immunoreactivity was observed.
Data analyses
Mapping double-labeled boutons at the confocal microscope.
To estimate the population of tracer-labeled boutons colocalized with m2 receptors, we used a confocal laser-scanning microscope (Olympus Fluoview; Olympus America) to image green (argon laser) and red (krypton laser) immunofluorescence label at high magnification (1000× oil). Channel bleed-through was checked by scanning red and green channels separately at levels of suspected colocalization. Stacks of images were captured at 0.5 μm z-intervals in one to two random sites within a region of anterograde labeling in layers I and II–IIIa. Three-dimensional deconvolution was applied to image stacks using Autodeblur (Media Cybernetics) to eliminate the inevitable fluorescent signal halo. Double-labeled boutons were assessed by manually searching through each confocal stack of images for boutons labeled in both red and green channels. Counts were cross-validated by using the colocalization finder in NIH ImageJ (version 1.32j for Windows) that automatically detects the overlap of red and green labeling at a set threshold. The results from the two methods were nearly identical. Tracer-labeled boutons with or without m2 receptor label were counted exhaustively in each stack (32 → 9, n = 9743 total boutons from two injection sites; 46 → 9, n = 9339 total boutons from two injection sites).
Mapping labeled synapses using serial EM.
We mapped synapses formed by prefrontal axons at the EM as described previously (Medalla et al., 2007). We first identified two to three coronal sections with the densest anterograde label through area 9 based on bright-field maps of the labeling pattern, as described previously (Medalla and Barbas, 2009, 2010). We then processed sections from matched levels in adjacent series for immunohistochemistry (as described above), which included the entire DLPFC from the dorsal bank of the principal sulcus to dorsomedial area 9. We then cut and processed for EM the tissue segments with label and flat embedded them in resin (as described above). For each case (injection site), we cut two 300-μm-wide cortical columns of dense anterograde label from layers I–IIIa of dorsal area 9, extending ∼700 μm from the pial surface, from the aclar-embedded segments, which were then reembedded in araldite blocks for ultrasectioning. Using an ultramicrotome (Ultracut; Leica), the blocks were trimmed with a diamond trim tool and then cut into serial ultrathin sections (50 nm) with a diamond knife (Diatome). Serial sections were collected on single-slot pioloform-coated grids and examined at 60 or 80 kV with a transmission EM (100CX; JEOL).
Boutons labeled with tracer from layers I and II–IIIa were identified and analyzed separately (32 → 9, layer I, n = 6 and layer II–IIIa, n = 6 sites from three cases; 46 → 9, layer I, n = 4 and layer II–IIIa, n = 4 sites from two cases). In the two pathways examined, boutons were sampled from a comparable volume of sites from each layer for each injection site and in proportion to the depth of the layers. The average tissue block face area was 195 × 278 μm for layer I and 506 × 280 μm for layers II–IIIa. The average total volume sampled for each injection site was ∼6.4 × 105 μm3 for layer I and ∼1.3 × 106 μm3 for layers II–IIIa. Boutons labeled with tracer and their postsynaptic elements were identified and photographed at 6600× or 10,000× using a film camera with negatives scanned at 1000 or 2000 dpi (Epson Perfection 4990 Photo Scanner; Epson America) or at 26,000× or 50,000× using a digital camera (Gatan Digital Micrograph).
Characterization of synaptic features was based on classic criteria (Peters et al., 1991). Systematic and exhaustive sampling of labeled boutons was conducted from 10–100 serial sections from each piece of tissue, which yielded an adequate sample of labeled boutons per injection site (32 → 9, n = 352 total boutons from three injection sites; 46 → 9, n = 108 total boutons from two injection sites) for either 2D or 3D analysis, as described previously (Medalla et al., 2007; Medalla and Barbas, 2009). As shown in the bright-field analysis of label of the entire pathway system (Medalla and Barbas, 2010), anterograde labeling from area 46 was less dense than from area 32, resulting in a lower yield of labeled boutons sampled exhaustively from each site within area 9.
One block from layers II–IIIa of each case was used for 3D reconstruction of labeled boutons and postsynaptic sites identified exhaustively in ∼80–100 serial sections. Each bouton was followed and photographed throughout adjacent serial sections and reconstructed in 3D using the open-source program Reconstruct [www.bu.edu/neural (Fiala, 2005)]. We estimated the thickness of sections using the method of cylindrical diameters (Fiala and Harris, 2001a). We traced object contours of boutons and postsynaptic elements manually section by section and marked the m2 positive (m2+) gold-labeled sites in the cytoplasm and membrane. We generated a 3D model and rendered m2+ sites as 40-nm-wide spheres to visualize receptor localization. Volume and surface area of presynaptic and postsynaptic elements were calculated. The 3D model was imported into 3D Studio Max (version 3; Autodesk) for additional rendering.
The rest of the blocks were used only for stereologic sampling and identification of labeled boutons and postsynaptic sites in shorter series of 10–50 sections. We sampled and photographed exhaustively all labeled boutons in either every section or every 10 adjacent sections (for longer series) at intervals of 1 μm (skipping ∼20 sections) to yield a proportional set of data points from each pathway.
Analysis of m2+ label and background levels in the neuropil.
Because silver-enhanced gold labeling of receptors can produce variable levels of signal-to-noise, we used several measures to identify labeled structures. First, we sampled at consistent depths in each tissue block, avoiding the first 1–2 μm of the block surface at which background is high. Second, we set a background threshold for each piece of tissue, according to previous criteria (Muly et al., 2009). We set a minimum diameter for silver-enhanced gold that was considered as positive label (>15–20 nm, depending on the kits used). We counted the total number of particles less than the size threshold in one in every five sections of each series and set as the background level the estimated total volume of small particles (number of particles × spherical volume of a single particle 15–20 nm in diameter) per volume of tissue sampled. To include a structure as m2+, it should have at least two distinct sites of enhanced gold labeling (>15–20 nm) across serial sections, and the volume of gold particles per volume structure should be at least five times more than the background level. Third, we sampled two sites through layers I–IIIa from each case to account for possible effects of uneven tissue fixation and antibody penetration. Four blocks had lower absolute density of m2+ synapses compared with the rest, which were within <10% SE. Even in blocks with low signal, the relative distribution of m2 label was consistent.
To determine whether the two pathways terminate within distinct microenvironments, we quantified the distribution of m2 receptors in synapses found in the neuropil surrounding tracer-labeled boutons. This method served as an additional control for the overall specificity of m2 receptor staining. Using Reconstruct, we used stereologic counting of asymmetric synapses with or without m2 gold label in the neuropil as described previously (Fiala and Harris, 2001b; Medalla and Barbas, 2009, 2010). In each termination site of 10–40 serial sections, labeled boutons were photographed at the center of the frame and synapses around it were exhaustively counted. For each synapse identified, we tabulated the type (asymmetric or symmetric), postsynaptic target (spine or dendritic shaft), and m2 receptor localization (presynaptic, postsynaptic, both, or neither sites). We sampled the neuropil surrounding a random set of labeled boutons to yield a comparable volume of tissue sampled in layers II–IIIa per pathway (n = ∼362 average number of synapses; ∼460 μm3 average volume of neuropil sampled per pathway, from two injection sites for each pathway).
Statistical analyses.
We tabulated the frequency of presynaptic and postsynaptic m2 receptors on synapses formed by tracer-labeled boutons and normalized the data as a proportion of the total number of synapses formed by all labeled boutons in each layer per case (injection site). The subpopulations of spines and dendritic shafts targeted by synapses with m2+ receptors were expressed as a proportion of either the total number of synapses formed by tracer-labeled boutons or the total number of m2+ presynaptic or postsynaptic elements.
We used nonmetric multidimensional scaling (NMDS) analysis to consider simultaneously all relevant parameters to assess similarities across cases and to visualize potential variability across injection sites. The parameters included overall and laminar target-specific presynaptic and postsynaptic m2 receptor distribution on prefrontal pathways: total percentage presynaptic m2+; percentage m2+ boutons on spines or dendrites; total percentage postsynaptic m2; and percentage postsynaptic m2+ spines and dendrites in layers I, II–IIIa, and the overall population in I–IIIa. NMDS analysis was conducted in Statistica (version 7 for Windows; Statsoft), using squared (dis)similarity matrices derived from m2 distribution profiles by Pearson's correlation as described previously (Dombrowski et al., 2001; Medalla and Barbas, 2006). NMDS considers all parameters within the multidimensional scale, and their relationship can be plotted as points in two or three dimensions. The relative proximity of the points in the NMDS scale represents their similarity. We ran the analysis using parameters from layers I, II–IIIa, and the overall population (in I–IIIa) and cross-validated by re-running the analysis with one set of parameters removed for each run. All runs produced the same NMDS plot and clustering scheme (p < 0.05 for all Pearson's r; alienation coefficient < 0.0001 for all clustering schemes).
Data sets from each layer and pathway (32 → 9, layers I and II–IIIa from three injection sites; 46 → 9, layers I and II–IIIa from two injection sites) were compared using one-way and multifactorial (main-effects) ANOVA to test the effects of pathway origin and layer for each variable measured, with significance level set at p < 0.05. In all comparisons, there were no significant differences between layers I and II–IIIa, so the data were pooled. Measurements were averaged across cases and reported as mean ± SD or SEM (confocal, n = 2 cases for each pathway; EM, n = 3 cases for 32 → 9 and n = 2 cases for 46 → 9) and graphed in Excel or using SigmaPlot (version 7 for Windows; SPSS).
Results
Overview of m2 labeling in DLPFC area 9 and relationship to pathways
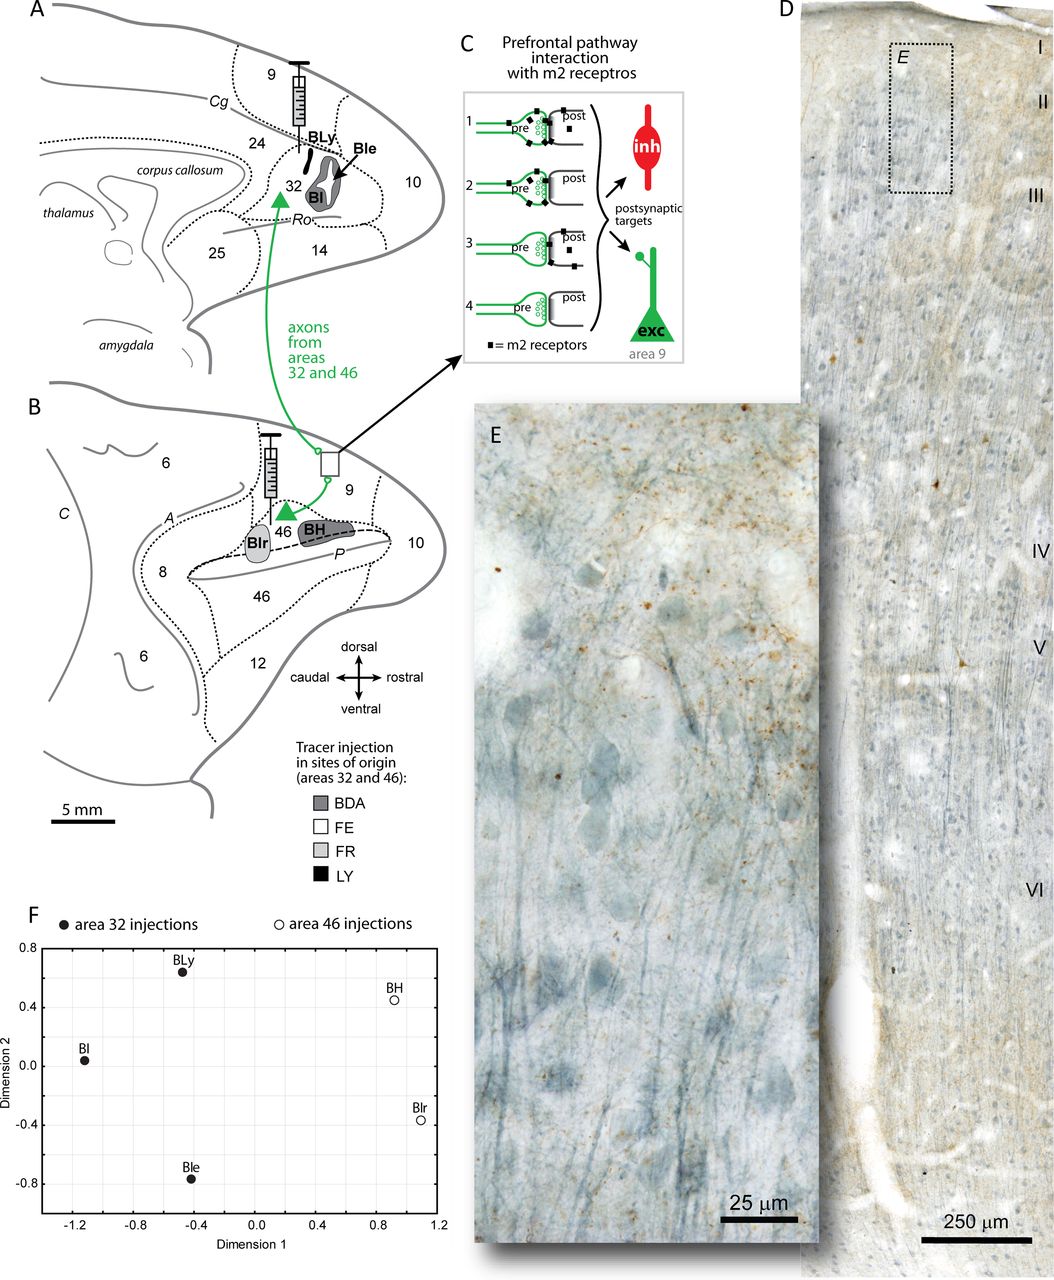
We first studied the overall distribution of cholinergic m2 receptors in DLPFC area 9. Labeling of m2 receptors on thin coronal sections (50 μm) revealed a band of strong label in the upper layers (I–IIIa) and in the deep layers (V–VI) of area 9 (Fig. 1D). Label for m2 was found in processes and, to a lesser extent, cell bodies of pyramidal and nonpyramidal neurons (Fig. 1E), consistent with previous studies in the cortex (Lidow et al., 1989; Mrzljak et al., 1993; Mrzljak et al., 1998; Erisir et al., 2001).

Labeling cholinergic m2 receptors on ACC and DLPFC pathways. A, B, Axon terminals in DLPFC area 9 were labeled with neural tracers in ACC area 32 (cases BI, BIe, and BLy) shown on the medial surface of the rhesus monkey brain (A), and in DLPFC area 46 (cases BIr and BH) on the lateral surface (long dashes depict the upper bank of the principal sulcus) (B). The inset in B shows the location of sites examined in area 9. Short dashes mark areal boundaries. A, Arcuate sulcus; C, central sulcus; Cg, cingulate sulcus; P, principal sulcus; Ro, rostral sulcus. C, Schematic of the possible relationships of m2 receptors (black squares) with labeled axon terminals from areas 32 and 46 (pre, green) and their postsynaptic targets (post, black) that can be either excitatory (exc) or inhibitory (inh): 1, m2 on both presynaptic and postsynaptic sites; 2, m2 on presynaptic boutons only; 3, m2 on postsynaptic sites only; and 4, no m2 interaction. D, Photomicrograph of a coronal section through DLPFC area 9 double labeled for BDA axon terminals from ACC area 32 (brown) and m2 cholinergic receptors (blue). E, Inset in D at higher magnification. Laminar labels are placed at the top of each cortical layer. F, NMDS plot shows the relative clustering of cases with distinct tracer injections in ACC area 32 or DLPFC area 46, as listed in A and B. NMDS analysis was used using Pearson's correlation based on target- and site-specific m2 receptor distribution (in layers I, II–IIIa, and pooled I-IIIa) on tracer-labeled pathways in DLPFC area 9. Tracer injections within the same architechtonic area were highly correlated (Pearson's r = 0.74–0.88, p < 0.05), more proximal and thus more similar to each other in terms of m2 distribution, than injections in a different area regardless of type of dye used. Cases with tracer injections in different architechtonic areas were dissimilar (area 32, filled circles vs area 46, open circles) as seen by the greater distance between data points in the NMDS plots and their lower correlation coefficients (r = 0.06–0.57; alienation coefficient < 0.0001 for this clustering scheme).
We then studied the interaction of m2 receptors in two distinct prefrontal pathways to area 9. The pathways, which were labeled with neural tracers, originated in either ACC area 32 or DLPFC area 46 and terminated in DLPFC area 9 (Fig. 1A,B). The injection sites in dorsal area 46 occupied a caudal part (case BIr) and a more rostral site within the same architectonic area (case BH; Fig. 1B). Injection sites in area 32 included two distinct tracers in the same animal, found in the central part and spanning through the entire dorsoventral extent of the area (cases BI and BIe; Fig. 1A). A third injection in area 32 (case BLy) occupied a relatively more dorsal and caudal sector (Fig. 1A). There was thus some variability in the topography and overall size of the injection sites. Nevertheless, the distribution of labeled fibers in dorsolateral area 9 was consistent among cases in each pathway, as found in previous quantitative analysis of the same pathways (Medalla and Barbas, 2010). In other studies, we found no evidence of hemispheric differences in the pattern or density of labeling in corticocortical or corticothalamic pathways (Germuska et al., 2006; Zikopoulos and Barbas, 2006, 2012; Medalla et al., 2007; Medalla and Barbas, 2010) or differences in labeling of pathways based on sex (Germuska et al., 2006; Zikopoulos and Barbas, 2006, 2012; Medalla et al., 2007). However, based on the cases in this study, we cannot rule out potential contributions of hemisphere or sex to the pattern of labeling.
The overall pattern and density of labeled boutons differed in the two pathways to area 9. Axons from area 32 terminated in wide columns covering a large extent of area 9, whereas axons from area 46 terminated in restricted patches in area 9. The two pathways to area 9 also differed in laminar termination pattern, with area 32 boutons found mostly in the upper layers, and area 46 boutons distributed evenly across the layers in a columnar pattern. We investigated layers I–IIIa of area 9, in which axons from both pathways terminated robustly.
We found that, in layers I–IIIa of area 9, m2 receptors were intermingled with the tracer-labeled axon fibers and terminals from areas 32 and 46 (Fig. 1D,E). As shown in Figure 1C, the tracer-labeled axons, which are excitatory (glutamatergic), could form asymmetric synapses on two postsynaptic targets: spines of presumed excitatory neurons (Fig. 1C, exc, green) or shafts of presumed inhibitory neurons (Fig. 1C, inh red). Furthermore, for any given synapse formed by a labeled bouton, m2 receptors could be present at both the presynaptic and postsynaptic sites (Fig. 1C1), only at the presynaptic site (Fig. 1C2), only at the postsynaptic site (Fig. 1C3), or at neither site (Fig. 1C4), totaling eight possible combinations. We computed the prevalence of each possible outcome at the EM in layers I and II–IIIa of each case. NMDS analysis using Pearson's correlation based on m2 receptor distribution profiles by layer (I and II–IIIa) and in the overall population (I–IIIa) showed the relative similarity (proximity) of injection sites within the same architectonic area (Fig. 1F). Area 32 cases (injection sites in cases BI, BIe, and BLy) resembled each other and were segregated from cases with tracer injections in area 46 (cases BH and BIr), regardless of type of dye used. Cases with tracer injection within one architectonic area showed higher within-group correlation coefficients (Pearson's r = 0.74–0.88, p < 0.05), whereas between-group correlation coefficients were lower (r = 0.06–0.57). Consistent with the NMDS analysis, multivariate comparisons of m2 receptor distribution profiles revealed a significant effect of pathway origin from area 32 or 46 (main-effects ANOVA, p < 0.05) but no effect by layer of termination (I vs II–IIIa, p > 0.05), as elaborated below.
The pathways from areas 32 and 46 formed asymmetric synapses in area 9 with spines, enriched in excitatory neurons, or aspiny/sparsely spiny dendritic shafts, characteristic of cortical inhibitory neurons (32 → 9, 79% on spines, 21% on shafts; 46 → 9, 89% on spines, 11% on shafts). However, the pathway from ACC area 32 targeted more shafts of presumed inhibitory neurons in DLPFC area 9 than the pathway from DLPFC area 46. We also found a pathway-specific difference in the size of boutons and synapses, which is correlated with synaptic efficacy (Tong and Jahr, 1994; Murthy et al., 1997; Germuska et al., 2006; Zikopoulos and Barbas, 2007; for review, see Nimchinsky et al., 2002; Bourne and Harris, 2008). Labeled boutons from area 32 and their associated synapses were relatively larger than those from area 46, especially boutons innervating dendritic shafts of presumed inhibitory neurons (bouton volume, ∼0.20 μm3 for 32 → 9, ∼0.17 μm3 for 46 → 9) or those that formed multiple synapses (volume, ∼0.39 μm3 for 32 → 9 and ∼0.28 μm3 for 46 → 9). These findings confirm and extend our previous studies (Medalla and Barbas, 2009, 2010).
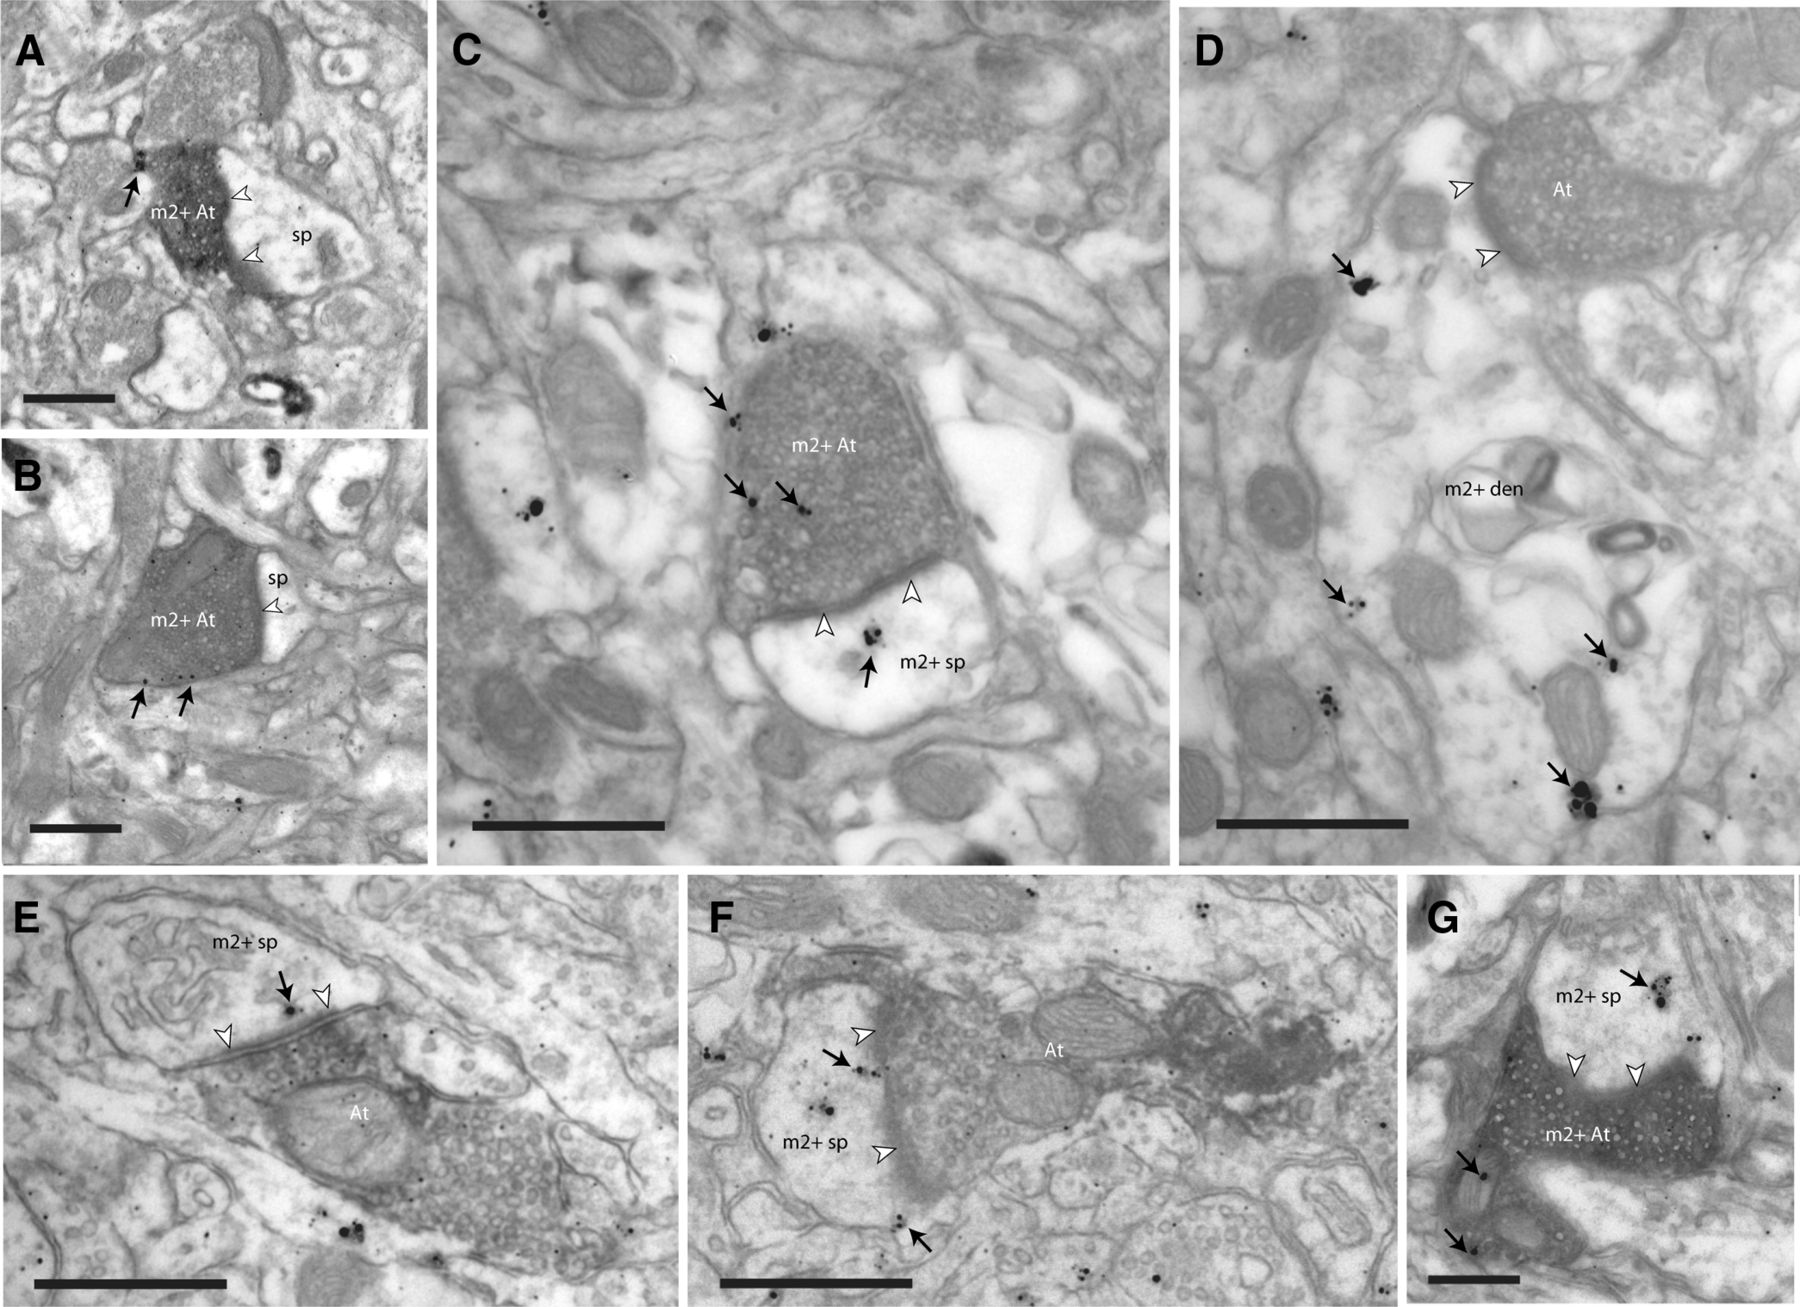
In the population of tracer-labeled boutons that formed identifiable synapses, m2 receptors labeled with silver-intensified gold were found presynaptically (Figs. 2A,B, light gray, C, 3A,B), postsynaptically (Figs. 2A,B, dark gray, D, 3D–F), or at both sites (Figs. 2A,B, crosshatch, E, 3C,G). In synapses with m2 labeling, most receptors were found in extrasynaptic and perisynaptic membranes (Fig. 3A–D), including a few that were near or within the presynaptic or postsynaptic membrane specializations (Fig. 3F), but some were found within the cytoplasm (Fig. 3D,E,G).

Distribution of m2 receptors on synapses formed by ACC (area 32) and DLPFC (area 46) pathways to DLPFC area 9. A, B, The center pie charts show the proportion of synapses formed by boutons from ACC area 32 to DLPFC area 9 (A) and DLPFC area 46 to DLPFC area 9 (B) with m2 receptors at presynaptic (m2+ pre, light gray) or postsynaptic sites (m2+ post, dark gray) only, at both sites (m2+ pre & post, crosshatch), or at neither site (m2 negative, m2−, white). Top pie charts (a1, b1) show synapses with presynaptic m2 on boutons (m2+ boutons) targeting spines (green) or dendritic shafts (red). Bottom pie charts (a2, b2) show synapses with postsynaptic m2 on spines (m2+ spines) or shafts (m2+ shafts). Insets show schematic of presynaptic (top) and postsynaptic (bottom) localization of m2 receptors on pathway synapses with spines of excitatory (exc, green) or dendritic shafts of inhibitory (inh, red) neurons. C–E, 3D reconstructions from serial EM images of tracer-labeled boutons and their synapses (postsynaptic density, PSD) and postsynaptic targets in layers II–IIIa of area 9 show the localization of m2 receptors. C, Bouton from area 32 (At) with presynaptic m2 receptors (m2+ pre, black dots) forming a synapse (PSD, blue) with a spine (sp, green). D, Bouton from area 32 (At) forming a synapse (PSD) with a smooth dendrite of an inhibitory neuron (den, pink) with postsynaptic m2 receptors (m2+ post). Note the presence of other synapses (not tracer-labeled, light blue) on the dendritic shaft, characteristic of the placement of synapses on dendrites of inhibitory neurons in the cortex. E, Bouton from area 46 (At) with presynaptic m2 receptors forming a synapse (PSD) with a spine (sp) with postsynaptic m2 receptors (m2+ pre and post). Scale cube, 0.5 μm3.

Localization of m2 receptors in synapses of tracer-labeled pathways. EM photomicrographs show tracer-labeled axon terminals (At) and m2 receptors (silver-enhanced gold particles; black arrows) near the synapse (white arrowheads). A, B, Presynaptic m2 receptors on the membranes of boutons from ACC (area 32) labeled with BDA tracer (m2+ At) innervating spines (sp) in area 9. C, Presynaptic m2 receptors on the membrane and cytoplasm of a tracer-labeled bouton from ACC (FE), which forms a synapse with a spine with postsynaptic m2 receptors (m2+ sp) in the cytoplasm (black arrows). D, Postsynaptic m2 receptors on the membrane and cytoplasm of a dendrite (m2+ den) innervated by a tracer-labeled bouton from ACC. E, F, Boutons from DLPFC area 46 labeled with tracer (FR), each innervating a spine with postsynaptic m2 receptors, near the postsynaptic density. G, Tracer-labeled bouton from area 46 (BDA) with presynaptic m2 receptors innervates a spine with postsynaptic m2 receptors in the cytoplasm. Scale bar, 0.5 μm.
Presynaptic specificity of m2 cholinergic receptors in pathways from areas 32 and 46 to area 9
We then examined the incidence of presynaptic m2 receptors on tracer-labeled boutons (m2+ boutons) from areas 32 and 46, in which they can inhibit neurotransmitter release (for review, see Lucas-Meunier et al., 2003). At the population level using confocal microscopy, we found that a significant proportion of axon terminals in the upper layers of area 9 were double labeled for m2 receptors and tracers injected in areas 32 or 46 (Figs. 4A, 5, yellow; an average of ∼9500 boutons per pathway). However, there was a higher proportion of m2+ boutons in the 32 → 9 pathway (37 ± 6% of tracer-labeled boutons) than in the 46 → 9 pathway (16 ± 9%; one-way ANOVA, p < 0.05; Fig. 4A).

ACC and DLPFC pathways differed in extent of presynaptic m2 receptors. Overall proportion of tracer-labeled boutons (synaptic and nonsynaptic) in layers I–IIIa of DLPFC area 9, with (black bars) or without (silhouette bars) m2 receptors, sampled at the confocal microscope (32 → 9, n = 9743 total boutons from 2 cases; 46 → 9, n = 9339 total boutons from 2 cases) (A) and at the EM (32 → 9 n = 352 total boutons from 3 cases; 46 → 9, n = 108 total boutons from 2 cases) (B). Presynaptic m2 receptors were significantly more prevalent in boutons from ACC area 32 than from DLPFC area 46 (*p < 0.05). Significantly different comparisons are indicated by matching symbols above the bars in each graph. C, Postsynaptic spines and dendrites targeted by tracer-labeled boutons with or without m2 receptors in each pathway. There were significantly more m2+ boutons (black asterisks, *p < 0.05) and concomitantly fewer m2− boutons (gray asterisks, *p < 0.01) that targeted spines in the area 32 pathway than in the area 46 pathway. In contrast, there were more m2− boutons that targeted shafts in the pathway from area 32 than from area 46 (#p < 0.01). Sum of all bars from each pathway is 100%.

Colocalization of tracer-labeled fibers with m2 receptors in the ACC pathway. A–C, Confocal image stack in layer I of DLPFC area 9 shows dual immunofluorescence labeling of axon fibers from ACC area 32 (FE tracer, green channel) (A) and m2 receptors (red channel) (B). C, Merged red and green channels show double-labeled fibers in yellow (yellow arrows). Some fibers were single labeled with tracer (white arrows) or m2 receptors only (blue arrows). Insets in A–C show the corresponding control experiment in an adjacent section and matched site. A, Inset, Immunofluorescence for tracer-labeled fibers (green, FE). B, Inset, Control; there was no evidence of m2 immunoreactivity when the primary antibody for m2 was omitted (red). C, Inset, Merge of A and B insets. D–F, Confocal image stack in layers II–IIIa of area 9 shows dual labeling of axon fibers from ACC area 32 (BDA tracer, red) (D) and m2 receptors (green) (E). F, Merged channels show double-labeled fibers in yellow (yellow arrows). Scale bar, 25 μm.
Electron microscopic analysis confirmed this pathway-specific difference, in which the effect was more pronounced because the detection threshold for m2 label is lower at the much higher resolution, and the postsynaptic targets are visible (an average of ∼230 boutons per pathway; Figs. 3, 4B). We found that the proportion of m2+ boutons (synaptic and nonsynaptic) from area 32 was significantly higher than from area 46 (32 → 9, 52 ± 3%; 46 → 9, 30 ± 2%; one-way and main effect ANOVA, p < 0.05; Fig. 4B). The difference was specifically attributable to a significantly higher prevalence of m2+ boutons from area 32 innervating spines (Fig. 4C, black asterisks, *p < 0.05). In general, most (84–90%) m2+ boutons targeted spines in both pathways (Fig. 2Aa1,Bb1). However, approximately half of the spine-targeting boutons in the 32 → 9 pathway had presynaptic m2 receptors (43 ± 3% of all boutons), nearly twice as many as in the 46 → 9 pathway (28 ± 6% of all boutons; Fig. 4C, black asterisks, *p < 0.05). The opposite pattern was found for spine-targeting boutons with no presynaptic m2 receptors, which were significantly more prevalent in the area 46 to 9 pathway (62 ± 1% of all boutons) than in the pathway from area 32 to area 9 (36 ± 2% of all boutons; Fig. 4C, gray asterisks, *p < 0.01).
In contrast, of all the boutons that innervated dendritic shafts, the proportion with presynaptic m2 receptors was similar in the two pathways (p = 0.73, 4–5% of all boutons; Fig. 4C, on shafts, black bars). Moreover, the proportion of these shaft-targeting boutons with no presynaptic m2 receptors was significantly higher in the area 32 → 9 pathway than in the 46 → 9 pathway (16 ± 1 vs 4 ± 2% of all boutons; Fig. 4C, #p < 0.01). The above evidence suggests that acetylcholine can act presynaptically through m2 receptors to inhibit the release of glutamate from boutons innervating spines more commonly in the ACC pathway to DLPFC area 9 than in the pathway linking the functionally similar DLPFC areas 46 to 9.
Postsynaptic specificity of m2 cholinergic receptors in pathways from areas 32 and 46 to area 9
We found that m2 receptors were also localized at postsynaptic sites, in which muscarinic activation has mostly depolarizing effects (for review, see Lucas-Meunier et al., 2003). The overall proportion of postsynaptic targets with m2 receptors was comparable in the two pathways that terminate in area 9 (32 → 9, 30 ± 7%; 46 → 9, 35 ± 9% m2+ postsynaptic sites of all pathway synapses). However, the two pathways differed in the proportion of their postsynaptic targets with m2 receptors, which are presumed to be excitatory (synapses on spines) or inhibitory (synapses on shafts) (Fig. 6). The pathway from area 32 targeted approximately the same proportion of spines or shafts with m2+ receptors in area 9 (55 ± 6% of all m2+ targets were on shafts; Figs. 2Aa2, 6B). In contrast, the pathway from area 46 targeted preferentially m2+ spines in area 9 (88 ± 3% of all m2+ targets; Figs. 2Bb2, 6B). Thus, the 32 → 9 pathway targeted significantly more m2+ dendritic shafts and concomitantly fewer m2+ spines than the 46 → 9 pathway (p < 0.01 for the ratio of m2+ spines to shafts; Fig. 6B). Most postsynaptic shafts innervated by area 32 were positive for m2 receptors (78 ± 10% of all shafts targeted; 15 ± 4% of all synapses), more than threefold higher than for the pathway from area 46 (21 ± 2% of all shafts targeted, p < 0.01; 3 ± 1% of all synapses; Fig. 6A, *p < 0.05). The opposite trend was found for the incidence of m2+ spines innervated by each pathway, but the difference was not statistically significant (p = 0.22; Fig. 6A). This evidence suggests that the potential m2 receptor-mediated postsynaptic effects of acetylcholine are more predominant on spines of presumed excitatory neurons innervated by area 46 but on shafts of presumed inhibitory neurons innervated by area 32.

ACC and DLPFC pathways differed in their postsynaptic targets with m2 receptors. A, The distribution of postsynaptic spines and dendrites with (black bars) or without (silhouette bars) m2 receptors targeted by pathways from ACC area 32 and DLPFC area 46 in layers I–IIIa of DLPFC area 9 obtained at the EM. Axons from ACC area 32 targeted more m2+ shafts than area 46 in area 9 (*p < 0.05). Significantly different comparisons are indicated by matching symbols above the bars in each graph. B, The relative distribution of m2+ spines and m2+ dendrites normalized to the total m2+ postsynaptic targets in each pathway. The ratio of m2+ spines: shafts significantly differed in the two pathways (*p < 0.01). Sum of all bars from each pathway is 100%.
m2 receptor distribution in the surrounding neuropil
We then investigated the distribution of m2 receptors in synapses in the neuropil surrounding tracer-labeled boutons to determine whether the two pathways terminate in distinct microenvironments. The distribution of m2 receptors in the surrounding neuropil was comparable across distinct termination sites of areas 32 and 46 in area 9, with similar m2 localization in the cytoplasm and membranes of presynaptic axons and boutons and postsynaptic spines and dendritic shafts. In the neuropil surrounding labeled boutons from both areas 32 (Fig. 7A) and 46 (Fig. 7B), most m2 receptors were associated with asymmetric synapses (∼95% of m2+ synapses), in which they were similarly localized on presynaptic and postsynaptic elements (∼26% of synapses with presynaptic m2; ∼23% with postsynaptic m2; ∼17% with both presynaptic and postsynaptic m2). Presynaptic m2 receptors in the neuropil were mostly found on synapses with spines (Fig. 7Aa1,Bb1; ∼90% of m2+ boutons). Postsynaptic m2 receptors were found on spines (∼62% of m2+ targets) and shafts (∼38% of m2+ targets; Fig. 7Aa2,Bb2) in proportions similar to the pathway from area 32 to area 9. A small proportion (∼5%) of synapses with presynaptic or postsynaptic m2 receptors were symmetric (and presumed inhibitory), which were also similar in the neuropil surrounding labeled boutons from both pathways (data not shown).

Distribution of m2 receptors in the neuropil surrounding labeled pathways in DLPFC area 9. A, B, The center pie charts show the overall population of synapses in the neuropil of layers II–IIIa of DLPFC area 9 surrounding tracer-labeled boutons from ACC area 32 (A) and DLPFC area 46 (B) and the proportions with m2 receptors at presynaptic (light gray) or postsynaptic sites (dark gray) only, at both sites (crosshatch), or at neither site (white). Top pie charts (a1, b1) show synapses in the neuropil with presynaptic m2+ on boutons targeting spines (excitatory, green) or dendritic shafts (inhibitory, red). Bottom pie charts (a2, b2) show synapses with postsynaptic m2+ receptors on spines or shafts. C–H, Photomicrographs show specificity of immunohistochemical labeling of m2 receptors in layers II–IIIa of DLPFC area 9 at the light microscope. C, Labeling of m2 receptors (DAB, brown) shows m2+ dendrites and m2+ somata of nonpyramidal neurons in layer II; D, the corresponding control experiment in an adjacent section with omission of the primary antibody for m2 shows no evidence of immunoreactivity. E, Labeling of m2 receptors using silver-enhanced gold-conjugated secondary antibodies shows the silhouettes of m2+ dendrites and m2+ somata (black grains); F, the corresponding control experiment shows no evidence of immunoreactivity. G, Confocal image stack shows m2 receptors labeled with green (488 nm) fluorescent-conjugated anti-rat IgG in layer II of area 9; H, the corresponding control experiment in an adjacent section shows no evidence of immunoreactivity in the green channel (top) or in the red channel (bottom), when the primary antibody for m2 was omitted. Scale bar, 25 μm.
The pattern of m2 receptor distribution in the surrounding neuropil also served as a control for the overall specificity of m2 receptor staining. The molecular specificity of the antibody has been described previously (Mrzljak et al., 1993; Levey et al., 1995), and here we found patterns of m2 labeling in area 9 both at the light and electron microscopes, consistent with previous findings in the cortex (Lidow et al., 1989; Mrzljak et al., 1998; Erisir et al., 2001). We found similar patterns of m2 labeling in tissue processed using counterbalancing methods (Figs. 1D,E, SG substrate; 5, 7G, fluorescence; 7C, DAB; 7E, silver-enhanced gold). Matched sections in control experiments, in which the primary antibody was omitted, yielded no labeling when processed for bright-field microscopy (Fig. 7D,F) or for immunofluorescence (Figs. 5A–C, insets, 7H), indicating the specificity of the antibody.
In summary (Fig. 8), the following features distinguish the two pathways with respect to m2 receptor distribution: (1) boutons from ACC area 32 that formed synapses with spines have more presynaptic m2 receptors than boutons from DLPFC area 46 (Fig. 8, insets, compare 1b, 2b); and (2) area 32 boutons targeted more m2+ dendritic shafts of inhibitory neurons (Fig. 8, left inset, 1c), whereas area 46 boutons targeted more m2+ spines (Fig. 8, right inset, 2d). These features collectively show prefrontal pathway specificity in m2 receptor localization, and in turn, suggest diversity in the associated cholinergic neuromodulatory influence.

Summary of predominant pathway-specific interactions with m2 receptors. Large black squares in center (gray) panels represent higher and small black squares represent lower incidence of m2 receptors. Line thickness represents strength of connection, and the relative size of terminals is depicted for each pathway. The possible effects of acetylcholine (ACh, orange) in these pathways during REM sleep (A) and active waking (B) are summarized as follows. A, In REM sleep, when cholinergic activity predominates, the ACC, which receives dense cholinergic innervation, is highly active but DLPFC, with lower cholinergic innervation, is relatively suppressed. Cholinergic suppression of ACC pathways to DLPFC area 9 (by presynaptic suppression of excitation and postsynaptic increase in inhibition) may help explain why in REM sleep the ACC does not induce excitation in DLPFC through robust excitatory pathways. The low activity of DLPFC areas and the connections interlinking them (46 → 9, dashed pathway) allows the inhibitory influence of ACC to predominate (inh, red), preserving the quiescent state of DLPFC during REM sleep. B, In active waking, cholinergic levels are also high, but DLPFC is active and under other neuromodulatory influences as well. Thus, the ACC-mediated inhibition can be balanced (or masked) by excitation in a highly active DLPFC but can selectively suppress weakly active sites (i.e., the fringes of task-related active columns). During demanding cognitive tasks, ACh binding (orange dots) can enhance the excitatory effects of the DLPFC pathway to potentially sustain task-related signals within a strongly active column, while strengthening the inhibitory effects of the ACC pathway to reduce noise. Insets show the actual data of the overall proportion of synapses with presumed excitatory and inhibitory neurons formed by boutons from ACC area 32 (left inset, center) and DLPFC area 46 (right inset, center), and the respective subpopulation of synapses with presynaptic (top: 1a, 1b, 2a, 2b) or postsynaptic (bottom: 1c, 1d, 2c, 2d) m2 receptors.
Discussion
The robust connections between the ACC and DLPFC underlie their communication and distinct roles in cognitive tasks (Kaping et al., 2011; for review, see Barbas et al., 2002; Lee et al., 2007; Johnston and Everling, 2008; Rushworth et al., 2011). Cholinergic modulation in the two regions differs perhaps because of the denser cholinergic innervation of ACC than DLPFC (Mesulam et al., 1992; Ghashghaei and Barbas, 2001). This anatomic inequality is accentuated during REM sleep, when cortical activity is under the predominant influence of the cholinergic system while other neuromodulatory systems remain dormant (for review, see Muzur et al., 2002). During REM sleep, the ACC is strongly activated but DLPFC is essentially silent (Maquet et al., 1996; Braun et al., 1997; Tian et al., 2002, 2006), despite a strong excitatory projection from ACC that targets primarily excitatory postsynaptic sites in DLPFC (Medalla and Barbas, 2010). Our findings suggest that this paradox may be explained by the synaptic specificity of m2 cholinergic receptors in the ACC pathway to DLPFC9 via dual mechanisms at presynaptic and postsynaptic sites.
At the presynaptic level, we found a higher prevalence of m2 receptors on boutons from ACC axons than in the pathway from area 46 to 9, two DLPFC areas that have common and likely synergistic roles in working memory (for review, see Petrides, 2000; Barbas et al., 2002). The significance of this synaptic specialization in the ACC pathway is based on physiologic findings indicating that activation of presynaptic cholinergic receptors may enhance or inhibit release of neurotransmitter from nerve terminals depending on receptor subtype (for review, see Levey, 1996; Lucas-Meunier et al., 2003; Hasselmo and Giocomo, 2006). Presynaptic suppression is primarily mediated by muscarinic receptors, especially the m2 subtype (Valentino and Dingledine, 1981; Levey et al., 1991; Hasselmo and Bower, 1992; Scanziani et al., 1995; Kimura and Baughman, 1997; Qian and Saggau, 1997; Fernández de Sevilla and Buño, 2003; Seeger et al., 2004; Hamam et al., 2007; Kremin and Hasselmo, 2007; Salgado et al., 2007; Levy et al., 2008). For example, in the hippocampal pathway to prefrontal cortex in mice, activation of axonal m2 receptors suppresses postsynaptic responses (Wang and Yuan, 2009). In primate DLPFC, m2 receptors are mainly localized on glutamatergic axon terminals (Mrzljak et al., 1993, 1998). We found that presynaptic m2 receptors were present mostly on boutons from ACC that formed excitatory synapses with spines of presumed excitatory neurons in DLPFC9. This evidence suggests that inhibitory cholinergic modulation during REM sleep affects primarily excitatory-to-excitatory synapses in the ACC to DLPFC9 pathway.
At the postsynaptic level, the ACC pathway showed a synaptic bias for innervating m2+ dendritic shafts of presumed inhibitory neurons in DLPFC9, whereas the pathway linking neighboring DLPFC areas (46 → 9) showed a bias for innervating m2+ spines of presumed excitatory neurons. The significance of this observation is based on evidence that acetylcholine has predominantly depolarizing effects on both excitatory and inhibitory postsynaptic sites in prefrontal and other cortices (for review, see McCormick, 1989; Lucas-Meunier et al., 2003). On cortical excitatory neurons, these effects are primarily mediated through m1 muscarinic receptors (for review, see Levey, 1996). In addition, the excitability of cortical GABAergic neurons is increased by acetylcholine through postsynaptic muscarinic and nicotinic receptors found on dendrites of inhibitory neurons (McCormick and Prince, 1985; Pitler and Alger, 1992; Behrends and ten Bruggencate, 1993; Kawaguchi, 1997; McQuiston and Madison, 1999; Porter et al., 1999; Kondo and Kawaguchi, 2001; Gulledge et al., 2007; Disney and Aoki, 2008). In primate DLPFC, m2 postsynaptic receptors are found on dendrites of a subset of inhibitory neurons (Mrzljak et al., 1993, 1998), as also seen here. On balance, we estimate that acetylcholine acts on more than half of the inhibitory neurons in DLPFC 9 targeted by ACC, suggesting substantial engagement of inhibition.
During REM sleep, cholinergic neurons in the basal forebrain fire at maximal rates and acetylcholine release is high (Marrosu et al., 1995; Lee et al., 2005). The combined presynaptic and postsynaptic specializations suggest that the high level of cholinergic activity during REM sleep can suppress activity in the ACC to DLPFC pathway. These effects may drown out the weaker cholinergic-mediated excitation in the upper layers of DLPFC, as summarized in Figure 8. In the pathway from area 46 to 9, the prevalence of postsynaptic m2 receptors on spines of excitatory neurons suggests that acetylcholine has primarily excitatory influence between two dorsolateral areas that have similar functions in working memory.
Cholinergic activity is also high in the attentive state (Himmelheber et al., 2000). However, pathway-specific cholinergic modulation can differ markedly in the awake state because the DLPFC is active and is also influenced by other neuromodulatory systems (for review, see Pace-Schott and Hobson, 2002; Stenberg, 2007). Sustained activation of DLPFC neurons that represent signals maintained in working memory is primarily dependent on facilitation of recurrent excitation within DLPFC (Wang, 1999; González-Burgos et al., 2000; Constantinidis et al., 2001). Muscarinic enhancement of excitatory DLPFC pathways may strengthen task-relevant signals, as shown in physiologic studies in nonhuman primates (Croxson et al., 2011; Zhou et al., 2011). This hypothesis is consistent with prefrontal–cholinergic interactions in attention and cognition (for review, see Hasselmo, 1995; Everitt and Robbins, 1997; Sarter et al., 2005). The predominance of postsynaptic muscarinic m2 receptors on excitatory neurons in the DLPFC pathway (46 → 9) found here is consistent with the functional data. In contrast, our finding of large ACC synapses on inhibitory neurons in DLPFC suggests enhanced mechanisms for decreasing weaker signals that represent “noise ” at the fringes of task-related active columns (Wang et al., 2004b; Medalla and Barbas, 2009, 2010). This mechanism of lateral inhibition may be further facilitated by cholinergic suppression of excitation through presynaptic m2 receptors or enhancement of inhibition mediated by postsynaptic activation of targeted GABAergic neurons. The balance of excitation and inhibition in these pathways is thus likely modulated by the synaptic specificity of m2 cholinergic receptors, as shown here.
The synergism of the ACC and the cholinergic system in suppressing noise in DLPFC is reflected in their recruitment in tasks with high cognitive demand. The ACC is engaged when dealing with noisy conflicting signals to suppress unwanted responses (for review, see Bush et al., 2000; Paus, 2001; Schall et al., 2002; Walton et al., 2007). Similarly, acetylcholine facilitates detection of targets among distracters (Parikh et al., 2007; Furey et al., 2008; for review, see Sarter and Bruno, 1997; Dalley et al., 2004; Hasselmo and McGaughy, 2004). This ACC influence likely does not have a significant impact on the much stronger signal in adjacent active columns.
Interestingly, during REM sleep, the ACC is reactivated along with other limbic cortices, the hippocampus, and amygdala, which are also strongly modulated by acetylcholine (for review, see Kahn and Hobson, 2005; Hasselmo, 2006). Activation of this limbic circuit facilitates learning and memory (for review, see Suzuki and Eichenbaum, 2000; McGaugh, 2002; Squire et al., 2004). In particular, the ACC receives a uniquely robust projection from the hippocampus and has considerably stronger connections with the amygdala than DLPFC (Barbas and Blatt, 1995; Insausti and Muñoz, 2001; Ghashghaei et al., 2007). The potential functional disconnection between ACC and DLPFC during REM sleep may allow activity in ACC and associated limbic structures to predominate (Maquet et al., 2000; Bunce and Barbas, 2011) and mediate the sleep-related enhancement of learning and memory (for review, see Buzsáki, 2002; Schwartz and Maquet, 2002; Walker and Stickgold, 2006).
The present study provides novel evidence that the cholinergic system can differentially modulate distinct prefrontal pathways in primates through m2 muscarinic receptors. These findings suggest that pathway specificity must be considered in future physiologic studies of m2 and other cholinergic receptors. The role of presynaptic nicotinic receptors is particularly intriguing for enhancing neurotransmitter release, the opposite of what appears to be the case for m2 presynaptic receptors. In the cortex, cholinergic enhancement of glutamate release at thalamocortical synapses through nicotinic-dependent presynaptic actions is thought to increase the gain of task-relevant signals (Hsieh et al., 2000; Disney et al., 2007; for review, see Sarter et al., 2005; Hasselmo and Giocomo, 2006).
The synaptic specialization of m2 receptors supports a role of prefrontal–cholinergic interactions in learning and memory functions during sleep and in cognitive operations during the awake state. These distinct effects may be mediated through cholinergic enhancement of activity in the ACC pathway during REM sleep and silencing activity in DLPFC. In the awake state, acetylcholine appears to enhance activity between DLPFC areas associated with cognition and decrease noise through the pathway from ACC to DLPFC. Interestingly, hyperactivation of ACC, associated limbic areas, and the cholinergic system is linked to mood disorders accompanied by sleep disturbances (Gillin et al., 1979; for review, see Janowsky et al., 1974; Mayberg, 1997; Phillips et al., 2003). Dysfunction of m2 receptors, in particular, has been correlated with impaired mood regulation in depression and bipolar disorder (Comings et al., 2002; Benson et al., 2004; Wang et al., 2004a; Cannon et al., 2006, 2011). These deficits may depend on the relative engagement of distinct prefrontal pathways and specific modulation by the cholinergic system.
Footnotes
This work was supported by National Institutes of Health Grants from the National Institute of Neurological Disorders and Stroke R01NS024760 and the National Institute of Mental Health RO1MH057414 and by Center of Excellence for Learning in Education, Science, and Technology (a National Science Foundation Science of Learning Center) Grant SBE-0354378. We thank Marcia Feinberg and Clare Timbie for technical assistance, Drs. Claus Hilgetag and Basilis Zikopoulos for consultation with statistics, Dr. John Fiala for help with 3D reconstruction, Drs. Michael Hasselmo, Alan Peters, and Jennifer Luebke for input, and Dr. Ron Killiany for help with imaging.
- Correspondence should be addressed to Helen Barbas, Boston University, 635 Commonwealth Avenue, Room 431, Boston, MA 02215. barbas{at}bu.edu


