

Article Figures & Data
Figures
- Figure 1.
Halo is specifically expressed in orexin neurons in the orexin/Halo transgenic mouse brain. A, Orexin-IR neurons are located in the LHA (Alexa Fluor 594, red). GFP-IR neurons, indicating Halo expression, are also observed in the LHA (Alexa Fluor 488, green). Merged picture shows specific expression of Halo in orexin neurons in the LHA in the orexin/Halo transgenic mice (top row). Scale bar, 100 μm. More than 90% of orexin neurons express Halo. GFP-IR is observed in the soma and dendrites. No expression of Halo other than in orexin neurons was observed throughout the brain. Bottom row is higher magnifications of square region in the top row. Scale bar, 50 μm. B, Confocal microscopic image of a 15-week-old orexin/Halo transgenic mouse showing that Halo expression is observed in the soma and dendrites of orexin neurons (arrows) but not in axons (arrowhead). Scale bar, 50 μm.
- Figure 2.
Orange light inhibits the activity of Halo-expressing orexin neurons. A, Under whole-cell current-clamp mode, orange light illumination induced instantaneous hyperpolarization and completely inhibited spontaneous action potentials in Halo-expressing orexin neurons. B, Neither blue nor orange light illumination had an effect on membrane potential or spontaneous firing frequency in orexin neurons expressing EGFP alone in orexin/EGFP mice. C, Orange light induced hyperpolarization in a light intensity-dependent manner in the presence of TTX. Light intensities are 1.5, 6, 25, and 100% (from left to right). D, Bar graph summarizing the data in C (n = 5). Halo (+) neuron, Halo-expressing orexin neurons from orexin/Halo mice; Halo (−) neuron, EGFP-expressing orexin neurons from orexin/EGFP mice. E, F, Brief (2 s), repetitive illumination (E) and longer (20 s), continuous illumination (F) induced hyperpolarization in the presence of TTX. G, Bar graph summarizing the data in E (n = 7). H, Orange light also inhibited current injection-induced action potentials. Orange light illumination for 10 s inhibited firing elicited by rectangular current pulse injection through the recording electrode (0.5 Hz, 4 pA, 250 ms). I, The bar graph shows the firing probability calculated from the data in H (n = 6). Firing probability is normalized to 10 s before light illumination. Orange light was applied through the objective lens, as represented by the colored bar. Values are represented as means ± SEM. *p < 0.05 vs orange light illumination of Halo (−) orexin neurons.
- Figure 3.
Orange light illumination induces an outward current in Halo-expressing orexin neurons. A, Under voltage-clamp mode, with membrane potential held at −60 mV, brief (2 s), repetitive orange light illumination induced an outward current in the presence of TTX. In contrast, blue light illumination had little effect. B, Longer (10 s) illumination induced a continuous outward current in the presence of TTX with membrane potential held at −60 mV. C, Bar graph summarizing blue or orange light-induced outward current under holding potentials of −40, −60, or −90 mV (n = 5–8). Halo (+), Halo-expressing orexin neurons from orexin/Halo mice; Halo (−), EGFP-expressing orexin neurons from orexin/EGFP mice. Blue or orange light was applied through an objective lens as indicated by gray bars. Blue or orange light application is dark gray or light gray, respectively. Values are represented as means ± SEM. *p < 0.05 vs Halo (−) neurons. Vh, Holding potential.
- Figure 4.
Orange light illumination blocks spontaneous firing of orexin neurons. A, In a loose cell-attached recording from Halo-expressing orexin neurons in vitro, brief (2 s) pulses of orange light illumination completely inhibited spontaneous firing. Top, Spontaneous action potentials; bottom, histogram of firing frequency plotted in 1 s bins. B, Bar graph summarizing the firing probability of orexin neurons during control conditions and during 2 s periods of orange illumination (n = 6). The firing probability was normalized to the spontaneous firing frequency during the 10 s before illumination. R1, Recovery period between first and second response. R2, Recovery period between second and third response. R3, Recovery period after third response. C, In a loose cell-attached recording from Halo-expressing orexin neurons in vitro, continuous illumination for 3 min also inhibited spontaneous firing. Regions indicated by bar and number were magnified in the bottom. D, Line graph summarizing data in C (n = 7). Basal frequency for 60 s before experiment was set as 100%. Orange light was applied through an objective lens as indicated by the gray bar. Values are means ± SEM. * or filled circle, p < 0.05 versus control.
- Figure 5.
Acute inhibition of orexin neurons induces SWS. EEG and EMG electrodes were chronically implanted to determine sleep/wakefulness state. Plastic fiber optics (0.5 mm diameter) were bilaterally inserted into the hypothalamus. Orange light from an LED (590 ± 5 nm) was applied through the fiber optics. A, Representative traces show EEG (top trace) and EMG (bottom trace) during orange light illumination during the second half of the light period (1:00 P.M. to 7:00 P.M.). Orange light illumination was initiated at a random time when orexin/Halo mice were awake. B, Bar graph shows EEG power spectra of each epoch (4 s) corresponding to A. Bar graph shows a typical EEG power spectrum before illumination (C), during illumination (D, E), and after cessation of illumination (F). Line graphs summarize the percentage of animals showing wakefulness (G, J), SWS (H, K), and REM sleep (I, L) during orange light illumination in the light period (1:00 P.M. to 7:00 P.M.; n = 7; G–I) and in the dark period (9:00 P.M. to 11:00 P.M.; n = 10; J–L). The data in G–L are based on experiments in which mice had been awake at least for 8 s (2 epochs) during either the light or dark period before orange light illumination. The orange shading indicates the period of light illumination. A total of seven mice were tested for in vivo photic illuminations. These mice were used for photic illumination during both the light and dark periods.
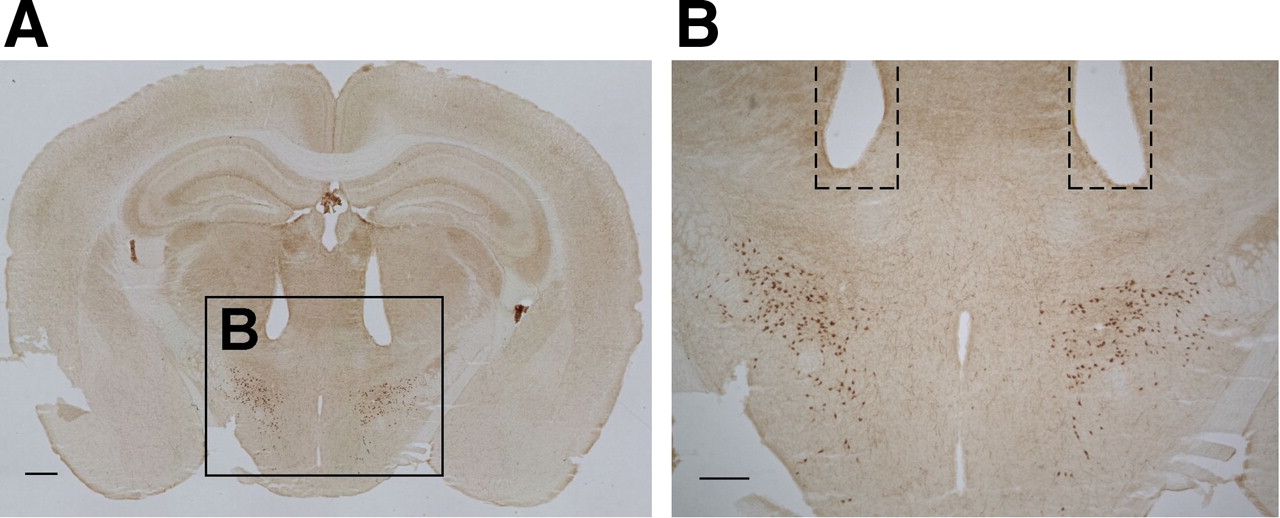
- Figure 6.
The location of the plastic fiber optic tip was confirmed after each experiment. Fiber optics were bilaterally implanted in the brain 1 mm above the LHA region in which orexin-IR neurons are located. A, Orexin-IR neurons (brown) show scattered distribution in the LHA (brown). Scale bar, 500 μm. B, Higher magnification of the square region indicated in A. Scale bar, 300 μm. Dashed line indicates the position of implanted fiber optics (0.5 mm in diameter).
- Figure 7.
Acute inhibition of orexin neurons induces SWS and decreases the activity of serotonergic DR neurons. A, Schematic drawing of in vivo extracellular recordings from the DR and photic illumination of the hypothalamus using fiber optics. EEG and EMG electrodes were implanted to determine sleep/wakefulness state. Plastic fiber optics (0.5 mm diameter) were bilaterally inserted into the hypothalamus. Orange light from LED (590 ± 5 nm) was applied through these fibers. Firing frequency of serotonergic DR neurons was recorded through a glass electrode inserted into the DR. B, Averaged shape of spikes classified as presumably serotonergic neurons (top traces) and nonserotonergic neurons (bottom traces) in the DR. Serotonergic DR neurons have longer action potential duration (∼1 ms) as well as a deflection in the negative component (arrow, top left trace) or a shoulder on the falling phase (arrow, top right trace). C, Bar graph summarizing the average EEG power density in the delta, theta, alpha, and beta bands during wakefulness, SWS, and REM sleep of wild-type littermate mice, orexin/Halo mice, and orexin/ataxin-3 mice during the light on period (n = 13). D, Bar graph summarizes the firing frequency of serotonergic neurons in the DR during wakefulness, SWS, and REM sleep recorded from wild-type littermate mice (n = 9–22), orexin/Halo mice (n = 6–26), and orexin/ataxin-3 mice (n = 12–17). E, Confirmation of an extracellular recording from neurons in the DR. The arrow shows PSB labeling (blue), indicating the location of the tip of the recording electrode (left). Scale bar, 500 μm. The right is a higher magnification of the rectangle in the left (right). Scale bar, 300 μm. F, G, Representative EEG/EMG recordings and firing frequency of DR neurons during orange light illumination in wild-type mice (F) and orexin/Halo mice (G). H, Power spectral analysis of EEG recorded from orexin/Halo mice (n = 12). The top graph shows power spectra of spontaneously occurring wakefulness, SWS, and REM sleep observed in orexin/Halo mice during the lights-on period (n = 6–26). The bottom graph shows power spectra: Pre, 30 s before illumination; Post, 30 s after illumination; 0–30 s, the first half 30 s illumination; 30–60 s, the second half 30 s illumination in orexin/Halo mice during the lights on period (n = 6–26). I, The average EEG power densities in the delta, theta, alpha, and beta wave bands (n = 12). Average power significantly increased in the second half of light illumination in all four frequency bands. J, Bar graph summarizing the firing frequency of serotonergic DR neurons during orange light illumination of orexin/Halo mice (n = 12). K, Bar graph summarizing integrated EMG levels. Integrated EMG levels were normalized to Pre, 30 s before illumination. Values are represented as means ± SEM. *p < 0.05.


Tables
Halo (+) orexin neurons EGFP (+) orexin neurons Resting membrane potential (mV) −52.8 ± 2.1 (n = 5) −52.5 ± 1.7 (n = 6) Peak amplitude (mV) 17.3 ± 1.6 (n = 6) 13.4 ± 3.0 (n = 5) Spontaneous firing (Hz) 4.8 ± 1.0 (n = 5) 4.7 ± 1.0 (n = 8) Input resistance (MΩ) 531.2 ± 76.7 (n = 7) 489.3 ± 30.2 (n = 12) Membrane capacitance (pF) 27.1 ± 1.5 (n = 9) 27.2 ± 2.0 (n = 11) Values are means ± SEM.
Pre Orange (0–30 s) Orange (30–60 s) Post Delta (%) 100 167.4 ± 49.9 165.9 ± 59.3 134.1 ± 21.8 Theta (%) 100 113.1 ± 22.4 113.9 ± 22.4 68.9 ± 10.3 Alpha (%) 100 164.0 ± 29.0 193.3 ± 50.0 106.2 ± 22.6 Beta (%) 100 130.9 ± 22.0 149.1 ± 39.1 85.1 ± 10.4 Total (%) 100 122.7 ± 12.7 176.6 ± 21.3 119.3 ± 6.9 The average EEG power densities were normalized to the EEG during the 30 s before illumination (n = 7). Pre, 30 s before illumination; Post, 30 s after illumination; 0–30 s, the first half 30 s illumination; 30–60 s, the second half 30 s illumination. Values are represented as means ± SEM.
- Table 3.
Episode duration of wakefulness, SWS, and REM sleep during light period of orexin/Halo transgenic mice and wild-type mice
Wild-type mice orexin/Halo mice Wakefulness (s) 80.3 ± 21.5 69.6 ± 14.2 SWS (s) 81.6 ± 10.4 79.9 ± 9.9 REM sleep (s) 82.2 ± 22.5 76.0 ± 12.6


