

Article Figures & Data
Figures
- Figure 1.
Schematic drawing of the morphology of the three types of spinal cord primary motor neurons, CaP (red), MiP (blue), and RoP (green) at ∼48 hpf (Myers et al., 1986). Each hemisegment contains one CaP, one MiP, and one RoP neuron. Locations of spinal cord, notochord, and ventral myotome are indicated. Dashed horizontal line is the horizontal myoseptum. Dashed chevrons mark the hemisegment boundaries.
- Figure 2.
Kv3.3 is expressed in fast-spiking primary motor neurons. A, At 48 hpf, zebrafish embryos were labeled with znp-1 (green), which labels the axons and terminals of primary motor neurons, and anti-Kv3.3 antibodies (red). The merged image is shown in the right panel. Arrows indicate regions of overlap. Scale bar (left image) (20 μm) applies to all panels except where noted. In all panels, dorsal is up and anterior is to the left. B, At 48 hpf, embryos were labeled with α-BgTx coupled to Alexa Fluor-647 (pseudo-colored green), which labels postsynaptic acetylcholine receptors, and with anti-Kv3.3 antibodies (red). Images were obtained from the same animal shown A. At right, the panel labeled 48 hpf shows a close-up of the area in the dashed box in the middle panel to highlight juxtaposition of α-BgTx and Kv3.3 labeling at synaptic sites (arrows). Scale bar, 5 μm, applies to the panels labeled 48 and 72 hpf. Right panel shows a 72 hpf embryo that has been labeled with znp-1 (green) and anti-Kv3.3 antibodies (red) to highlight Kv3.3 localization on side branches that resemble mature motor neuron terminals (arrows). C, Panels show labeling of MiP axons (arrows) by α-BgTx (pseudo-colored magenta), znp-1 (green), and anti-Kv3.3 (red). Right panel shows a triple overlay. The dashed line indicates the position of the horizontal myoseptum. All images correspond to single optical sections (0.4884 μm).
- Figure 3.
Kv3.3 labeling was not detected in sensory or secondary motor neurons. A, At 48 hpf, embryos were labeled with 39.4D5 (green), which labels nuclei of sensory and motor neurons, and anti-Kv3.3 antibodies (red). The merged image is shown in the right panel. The arrowheads and arrows indicate the cell bodies of sensory and motor neurons, respectively. Scale bar, 20 μm, applies to all panels. Dorsal is up and anterior is to the left. B, At 48 hpf, embryos were labeled with zn-8 (green), which labels secondary motor neurons, and anti-Kv3.3 antibodies (red). The merged image is shown in the right panel. Arrows in the left and right panels indicate the long axon of a secondary motor neuron. All images correspond to single optical sections (0.4884 μm).
- Figure 4.
Expression of the R420H subunit reduces the excitability of CaP motor neurons. A, Action potential firing was evoked in patch-clamped CaP motor neurons from uninjected (black), EGFP-injected (blue), or R420H + EGFP-injected animals (red). Spikes were evoked by depolarizing the membrane to −25 mV. Representative results are shown. B, To verify that patched cells were CaP neurons, cells were filled with sulforhodamine B via the patch pipette. A representative cell is shown. Left, EGFP fluorescence; middle, sulforhodamine B fluorescence in same neuron; right, merged image. Dorsal is up and anterior is to the left. Scale bars, 10 μm. C, Average action potential frequencies have been plotted versus stimulus amplitude for uninjected (black squares, n = 9), EGFP-injected (blue triangles, n = 5), and R420H+EGFP-injected (red circles, n = 9) animals. Values are shown as mean ± SEM, significantly different from uninjected and EGFP-injected: *p < 0.05, †p < 0.005, ‡p < 0.0005 by one-way ANOVA with Friedman post hoc test. D, Top, Raster plots of action potentials in CaP motor neurons during evoked firing from uninjected (black), EGFP-injected (blue), or R420H + EGFP-injected (red) animals are shown. Each row represents a CaP neuron from a different animal. Bottom, Histograms show the number of evoked action potentials during 30 ms bins for uninjected (black), EGFP-injected (blue), and R420H + EGFP-injected (red) animals. In C and D, spikes were evoked by depolarizing the membrane to −20 mV.
- Figure 5.
R420H subunit reduces the number of spikes per burst in CaP neurons during fictive swimming. A, Bursting activity was recorded from uninjected (top) or R420H + EGFP-injected (bottom) animals. B, R420H expression significantly reduced the number of spikes per burst (left) but had no effect on burst duration (middle) or interburst interval (right) compared with uninjected controls. The average numbers of spikes per burst were 11.3 ± 1.4 (n = 9) and 5.9 ± 0.3 (n = 9) in control and R420H + EGFP-injected animals, respectively. Values are provided as mean ± SEM *p < 0.05 by Mann–Whitney U test.
- Figure 6.
R420H subunit increases action potential duration. The figure shows averaged action potential shapes recorded in CaP motor neurons in uninjected (black, n = 9), EGFP-injected (blue, n = 5), and R420H + EGFP-injected (red, n = 9) animals. Mean peak amplitudes were 51.3 ± 3.6, 48.6 ± 5.5, and 41.8 ± 10.1 mV for uninjected, EGFP-injected, and R420H + EGFP-injected animals, respectively. Spike durations measured at half-amplitude averaged 2.5 ± 0.31, 2.5 ± 0.35, and 3.7 ± 0.78 s for uninjected, EGFP-injected, and R420H + EGFP-injected animals, respectively. Action potentials in R420H-expressing CaP neurons tended to be smaller in amplitude and shorter in duration than those in control cells, but the measured values did not differ significantly (one-way ANOVA, p > 0.05). Top, Values are shown as mean ± SEM. Bottom, Error bars are omitted for clarity.
- Figure 7.
R420H subunit specifically reduces the amplitude of voltage-dependent outward currents in CaP motor neurons. A, Representative voltage-dependent currents were recorded at +25 mV in CaP motor neurons from uninjected (black), EGFP-injected (blue), and R420H + EGFP-injected (red) animals. Inset, Magnified view of inward currents. B, Peak outward current amplitudes have been plotted versus voltage for CaP motor neurons from uninjected (black squares, n = 9), EGFP-injected (blue triangles, n = 5), and R420H + EGFP-injected (red circles, n = 9) animals. Values are shown as mean ± SEM. If error bars are not visible, they are smaller than the symbol. *p < 0.05, †p < 0.005, ‡p < 0.0005, differs significantly from uninjected and EGFP-injected by one-way ANOVA with Friedman post hoc test. C, Peak inward current amplitudes have been plotted versus voltage for CaP motor neurons from uninjected (black squares, n = 9), EGFP-injected (blue triangles, n = 5), and R420H + EGFP-injected (red circles, n = 8) animals. Values are shown as mean ± SEM. If error bars are not visible, they are smaller than the symbol. Inward current amplitudes did not differ significantly.
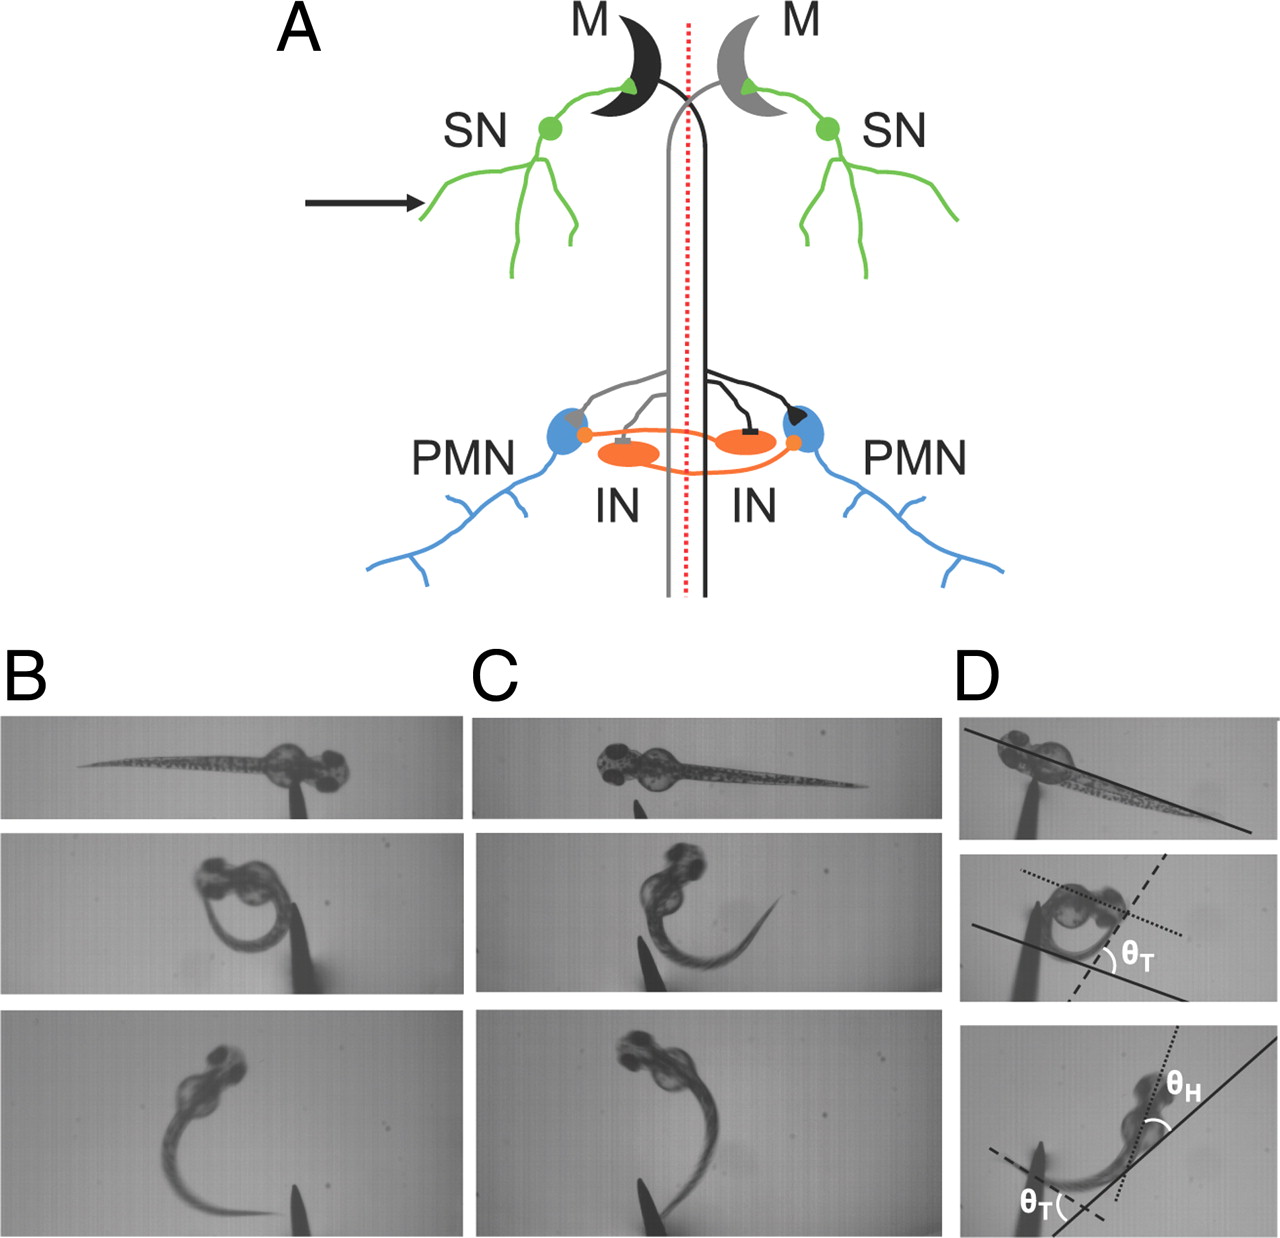
- Figure 8.
Startle response in zebrafish. A, Simplified startle response circuitry is shown (Korn and Faber, 2005). Two bilaterally symmetric Mauthner cells (M) (black and gray) are innervated by ipsilateral sensory neurons (SN) (green). Arrow indicates tactile stimulus. Mauthner axons cross the midline to form chemical synapses on contralateral CaP motor neurons (PMN) (blue) and electrical synapses on contralateral interneurons that mediate reciprocal inhibition (IN) (orange). B, A startle response was evoked in an EGFP-injected animal at 55–60 hpf. The panels show individual frames from a high-speed video. Top, Before the stimulus. Middle, Maximal C-start. Bottom, Maximal counterbend. C, A startle response was evoked in an R420H + EGFP-injected animal at 55–60 hpf. Panels follow the description in part B. D, The startle response was characterized quantitatively as shown. Top, Solid line marks the initial orientation of the fish. Middle, The dotted and dashed lines mark the orientations of the head and tail, respectively, at the maximal C-start angle. Angular deviations of the head (θH) and tail (θT) from the original orientation (solid line) were measured. θH equals the change in head trajectory; θH + θT equals the maximal C-start angle. In this example, θH was close to 180°, so the intersection of the lines is not visible in the area shown. Bottom, The maximal counterbend angle was defined as θH (dotted) + θT (dashed) relative to a line tangential to the animal's body (solid). Frames in D were obtained using an uninjected animal at 55–60 hpf.
- Figure 9.
R420H subunit reduces the precision and amplitude of the startle response. A–C, Left panels show results from individual startle response assays performed on uninjected, EGFP-injected, or R420H + EGFP-injected animals: change in head trajectory (A), maximum C-start angle (B); maximum counterbend angle (C). In C, a negative counterbend angle indicates that the counterbend and the C-start were in the same direction. Mean change in head trajectory: uninjected, 193 ± 8° (n = 43 assays, conducted on 16 animals); EGFP-injected, 172 ± 5° (54 assays on 22 animals); R420H + EGFP-injected, 143 ± 6° (79 assays on 27 animals). Values are provided as mean ± SEM. R420H differed significantly from EGFP and uninjected, p < 0.001 by one-way ANOVA followed by Student's t test. Mean maximum C-start angle: uninjected, 252 ± 5° (42 assays); EGFP, 245 ± 5° (54 assays); R420H + EGFP, 213 ± 6° (79 assays). Values are provided as mean ± SEM. R420H differed significantly from EGFP and uninjected, p < 0.001 by one-way ANOVA followed by Student's t test. Mean maximum counterbend angle: uninjected, 111 ± 5° (38 assays); EGFP, 115 ± 4° (49 assays); R420H, 79 ± 8° (72 assays). R420H differed significantly from EGFP and uninjected, p < 0.01 by one-way ANOVA followed by Student's t test. There were fewer counterbend measurements because the head or the tail was sometimes out of frame during this phase of the response. In the right panels, results from startle response assays performed on EGFP-injected (open bars) or R420 + EGFP-injected (black bars) animals have been binned and plotted versus percentage of total responses: change in head trajectory (A), maximum C-start angle (B), maximum counterbend angle (C). In A and C, binned data have been fitted with Gaussian functions of the form y = (A/(w*
 ))*exp(−2*((x − xc/w)⋀2), where A is area, w is width at half-maximal amplitude, and xc is center of the distribution. The fits are superimposed on the histograms: EGFP-injected, dashed line; R420H + EGFP-injected, solid line. The fitted distributions of change in head trajectory (A) and maximum counterbend angle (C) for EGFP- and R420H + EGFP-injected animals differed significantly, p < 0.01 using F test in Origin 7. Fitted parameters, change in head trajectory: EGFP, A = 100.6 ± 0.8, w = 1.59 ± 0.01, xc = 4.9 ± 0.01; R420H, A = 99.9 ± 2.8, w = 2.18 ± 0.07, xc = 4.4 ± 0.04. Fitted parameters, maximum counterbend angle: EGFP, A = 96.1 ± 2.8, w = 1.1 ± 0.04, xc = 5.9 ± 0.03; R420H, A = 96.5 ± 4.5, w = 1.9 ± 0.1, xc = 5.3 ± 0.05. Data in B, right panel, were not fitted because the R420H results were not well described by a normal distribution.


