

Article Figures & Data
Figures
- Figure 1.
Aberrant mossy fiber sprouting was measured by drawing contours around the entire granule cell layer (g) + molecular layer (m) (magenta line) and the Timm-positive part (cyan line) (A). h, Hilus; CA3, CA3 pyramidal cell layer. B, Isolated outlines with Timm-positive contour filled. Areas were recorded, and the percentage of the entire granule cell layer + molecular layer that was Timm positive was calculated.
- Figure 2.
The mTOR signaling pathway in hippocampus was activated by status epilepticus and inhibited by prolonged infusion of rapamycin. Ribosomal protein S6 is phosphorylated by the mTOR signaling pathway. Ratios of phospho-S6 to total S6 were measured by Western blot analysis to evaluate activity of the mTOR pathway. Each lane is a different sample, and all bands were at 32 kDa. A, Ratios were similar in vehicle-treated (n = 5) and pilocarpine-treated (n = 6) controls. Ratios 24 h (n = 6) and 7 d after status epilepticus (n = 6) were significantly greater than controls (C) (*p < 0.05, Kruskal–Wallis ANOVA on ranks). B, After 14 d of continuous infusion of 10 mm rapamycin, S6 phosphorylation was reduced compared with contralateral hippocampal tissue. C, Average ratios of phospho-S6 to total S6 in infused versus noninfused, contralateral hippocampi were significantly different (**p = 0.004, paired t test, n = 6). Error bars indicate SEM.
- Figure 3.
Fluorescence verified delivery of osmotic pump contents to infused but not contralateral dentate gyrus. A, Left, dorsal dentate gyrus of a rat infused for 1 month with 0.01 mm rapamycin dissolved in vehicle containing 0.1% fluorescein. The asterisk indicates the cannula site. B, Corresponding septotemporal level of right, contralateral, noninfused dentate gyrus. Images were acquired with identical microscope and camera settings. m, Molecular layer; g, granule cell layer; h, hilus; CA3, CA3 pyramidal cell layer.
- Figure 4.
Prolonged, 1 month infusion of rapamycin reduced aberrant Timm staining. Timm stained dentate gyrus in vehicle-infused (A) and contralateral noninfused (B) hippocampus and in 10 mm rapamycin-infused (C) and contralateral noninfused (D) hippocampus. Asterisks indicate infusion sites (A, C). g, Granule cell layer; m, molecular layer; h, hilus; CA3, CA3 pyramidal cell layer. E, Higher-magnification views reveal less aberrant Timm staining in rapamycin-infused regions. E1, Vehicle-infused hippocampus (arrow in A). E2, Rapamycin-infused hippocampus at septotemporal level of cannula (arrow in C). E3, Rapamycin-infused hippocampus at 180 μm toward temporal pole of hippocampus from section shown in C and E2. E4, Contralateral noninfused hippocampus (arrow in D). F, The average percentage of area of the granule cell layer (gcl) + molecular layer (ml) that is Timm positive versus section position along the septotemporal axis relative to infusion site in rats infused with 10 mm rapamycin (n = 8). Infusion site = 0. The septal pole is to the left (negative values). The temporal pole is to the right (positive values). G, Difference in the percentage of the granule cell layer + molecular layer that is Timm positive in infused minus contralateral noninfused hippocampi. Negative values indicate reduced aberrant Timm staining in infused hippocampi. Values calculated in individual animals by averaging results of the three sections closest to the infusion site (between dashed vertical lines in F) and corresponding sections in the contralateral hippocampus. Hippocampi infused with 10 mm (n = 8), 1 mm (n = 4), and 0.1 mm (n = 3) rapamycin displayed less aberrant Timm staining than those infused with 0.01 mm rapamycin (n = 4) or vehicle alone (n = 6) (*p < 0.05, ANOVA with Bonferroni t test). Error bars indicate SEM.
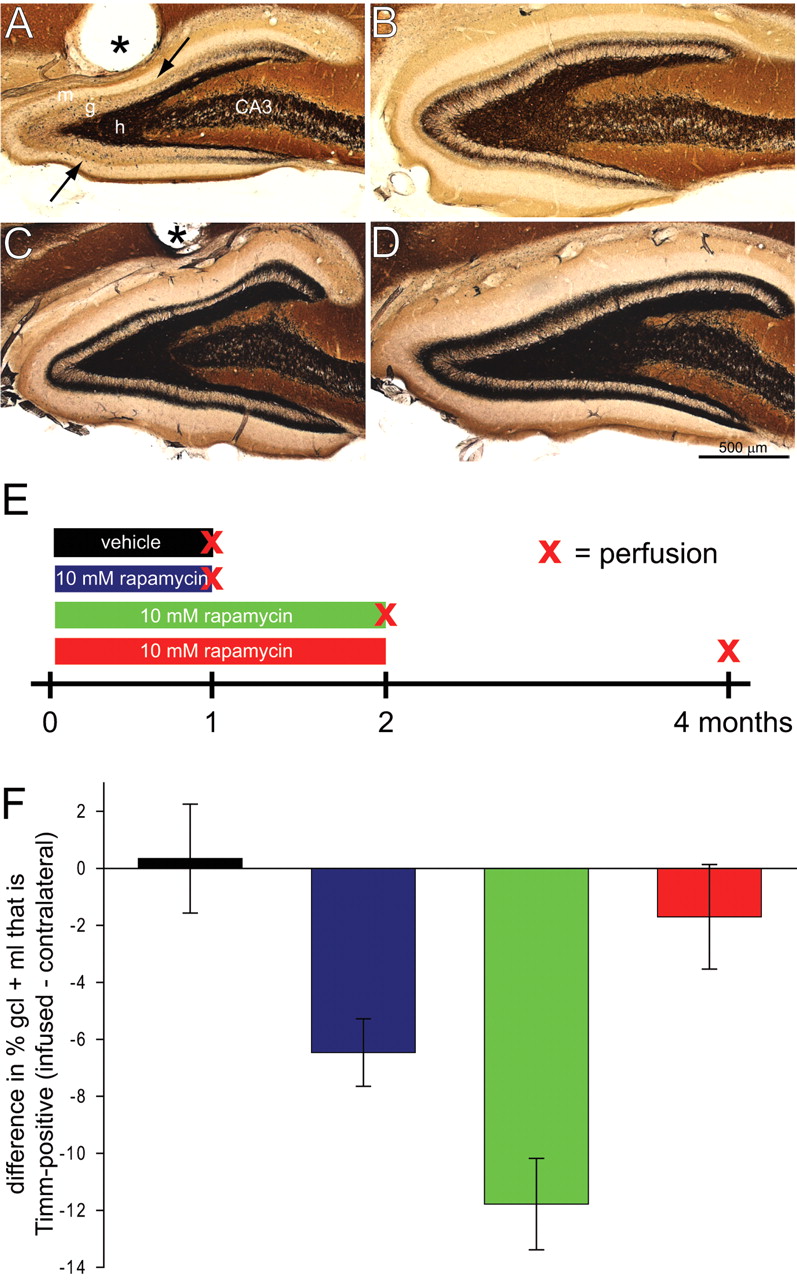
- Figure 5.
Longer rapamycin infusion suppressed mossy fiber sprouting more, but the effect reversed after infusion ceased. Timm stained dentate gyrus after 2 months of continuous infusion with 10 mm rapamycin (A) and contralateral noninfused hippocampus (B). The asterisk indicates the infusion site. Arrows indicate reduced Timm staining in the granule cell layer (g) and molecular layer (m) in the rapamycin-infused hippocampus. h, Hilus; CA3, CA3 pyramidal cell layer. Timm stained dentate gyrus after 2 months of continuous infusion with 10 mm rapamycin followed by 2 more months without infusion (C) and contralateral noninfused hippocampus (D). E, Experimental time line indicating duration of treatment (colored horizontal bars) and timing of perfusion (red “x”). F, Difference in the percentage of the granule cell layer (gcl) + molecular layer (ml) that is Timm positive in infused minus contralateral noninfused hippocampi. Negative values indicate reduced aberrant Timm staining in infused hippocampi. Values were calculated in individual animals by averaging results of the three sections closest to the infusion site and corresponding sections in the contralateral hippocampus. The color of the vertical bars corresponds to the color of the horizontal bars in E, which indicate experimental group. Aberrant Timm staining was reduced more in rats infused with 10 mm rapamycin for 2 months (n = 3) than in those infused only 1 month (n = 8, p = 0.04, unpaired t test) and those infused for 2 months but then allowed to survive another 2 months after infusion ceased (n = 4, p = 0.01, unpaired t test). Results from vehicle-infused rats (n = 6) are displayed for comparison. Error bars indicate SEM.
- Figure 6.
Rapamycin infusion did not reverse mossy fiber sprouting after it had developed. Timm stained dentate gyrus after 1 month infusion with 10 mm rapamycin, beginning 2 months after status epilepticus (A) and contralateral noninfused hippocampus (B). The asterisk indicates the infusion site. m, Molecular layer; g, granule cell layer; h, hilus; CA3, CA3 pyramidal cell layer. C, Experimental time line indicating duration of treatment (colored horizontal bars) and timing of perfusion (red “x”). D, Difference in the percentage of the granule cell layer (gcl) + molecular layer (ml) that is Timm positive in infused minus contralateral noninfused hippocampi. Negative values indicate reduced aberrant Timm staining in infused hippocampi. Values were calculated in individual animals by averaging results of the three sections closest to the infusion site and corresponding sections in the contralateral hippocampus. The color of the vertical bars corresponds to the color of the horizontal bars in C, which indicate experimental group. Aberrant Timm staining is reduced more in rats when 10 mm rapamycin is infused beginning immediately after status epilepticus (n = 8) than in those in which onset of infusion was delayed 2 months (n = 6, p = 0.002, unpaired t test). Results from vehicle-infused rats (n = 6) are displayed for comparison. Error bars indicate SEM.
- Figure 7.
Rapamycin infusion did not protect hilar neurons from status epilepticus-induced loss. Nissl stained dentate gyrus after 1 month infusion with 10 mm rapamycin (A) and contralateral noninfused hippocampus (B). The asterisk indicates the infusion site. m, Molecular layer; g, granule cell layer; h, hilus; CA3, CA3 pyramidal cell layer. C, The average number of hilar neuron profiles per section in the three sections closest to the infusion site and corresponding sections of contralateral hippocampus for all experimental groups. The number of hilar neuron profiles was slightly and consistently lower in infused than in contralateral hippocampi (p = 0.006, ANOVA), regardless of experimental group. Error bars indicate SEM.
- Figure 8.
Density of staining within Timm-positive contours was not more intense in rapamycin-infused hippocampi. The average optical density (0, no tissue in light path; 1, microscope light source turned off) within Timm-positive contours in three sections within ±200 μm of infusion site and corresponding sections of contralateral noninfused hippocampus for all experimental groups is shown. Within each experimental group, densities of aberrant Timm staining were similar in infused and contralateral, noninfused hippocampi (ANOVA, p = 0.4). Error bars indicate SEM.


