

Article Figures & Data
Figures
- Figure 1.
Increased dopamine D1-receptor-mediated cell death in STHdhQ111 striatal cells. A, Wild-type (ST7/7Q) and mutant (ST1111/111Q) striatal cells were treated with different concentrations of the D1 receptor agonist SKF38393 (30, 60, 80, or 100 μm) or the D2 receptor agonist quinpirole (30, 60, or 150 μm) during 24 h. After treatment, cell survival was measured by scoring the percentage of Hoechst-stained nuclei. Forty fields were counted per condition per experiment, comprising at least 30–40 cells. Results are expressed as percentage of control (vehicle-treated) cells, and data are the mean ± SD of three independent experiments performed in triplicate. A full statistical analysis by the two-way ANOVA is described in the text. ***p < 0.001 treated versus vehicle-treated wild-type cells; +++p < 0.001 treated versus vehicle-treated mutant cells; ##p < 0.01, ###p < 0.001 treated mutant cells versus treated wild-type cells (Bonferroni's multiple comparison test). CNT, Control. B, Wild-type and mutant striatal cells were treated (1 h) with the D1 receptor antagonist SCH23390 (10 μm) before SKF38393 treatment (100 μm). Cell survival was assessed 24 h later by scoring the percentage of Hoechst-stained nuclei. Forty fields were counted per condition per experiment, comprising at least 30–40 cells. Results are expressed as percentage of control (vehicle-treated) cells, and data are the mean ± SD of three independent experiments performed in triplicate. ***p < 0.001 treated versus vehicle-treated wild-type cells; +++p < 0.001 treated versus vehicle-treated mutant cells; $$$p < 0.001 SCH23390 plus SKF38393-treated wild-type cells versus SKF38393-treated wild-type cells; &&&p < 0.001 SCH23390 plus SKF38393-treated mutant cells versus SKF38393-treated mutant cells as determined by one-way ANOVA followed by Bonferroni's multiple comparison test.
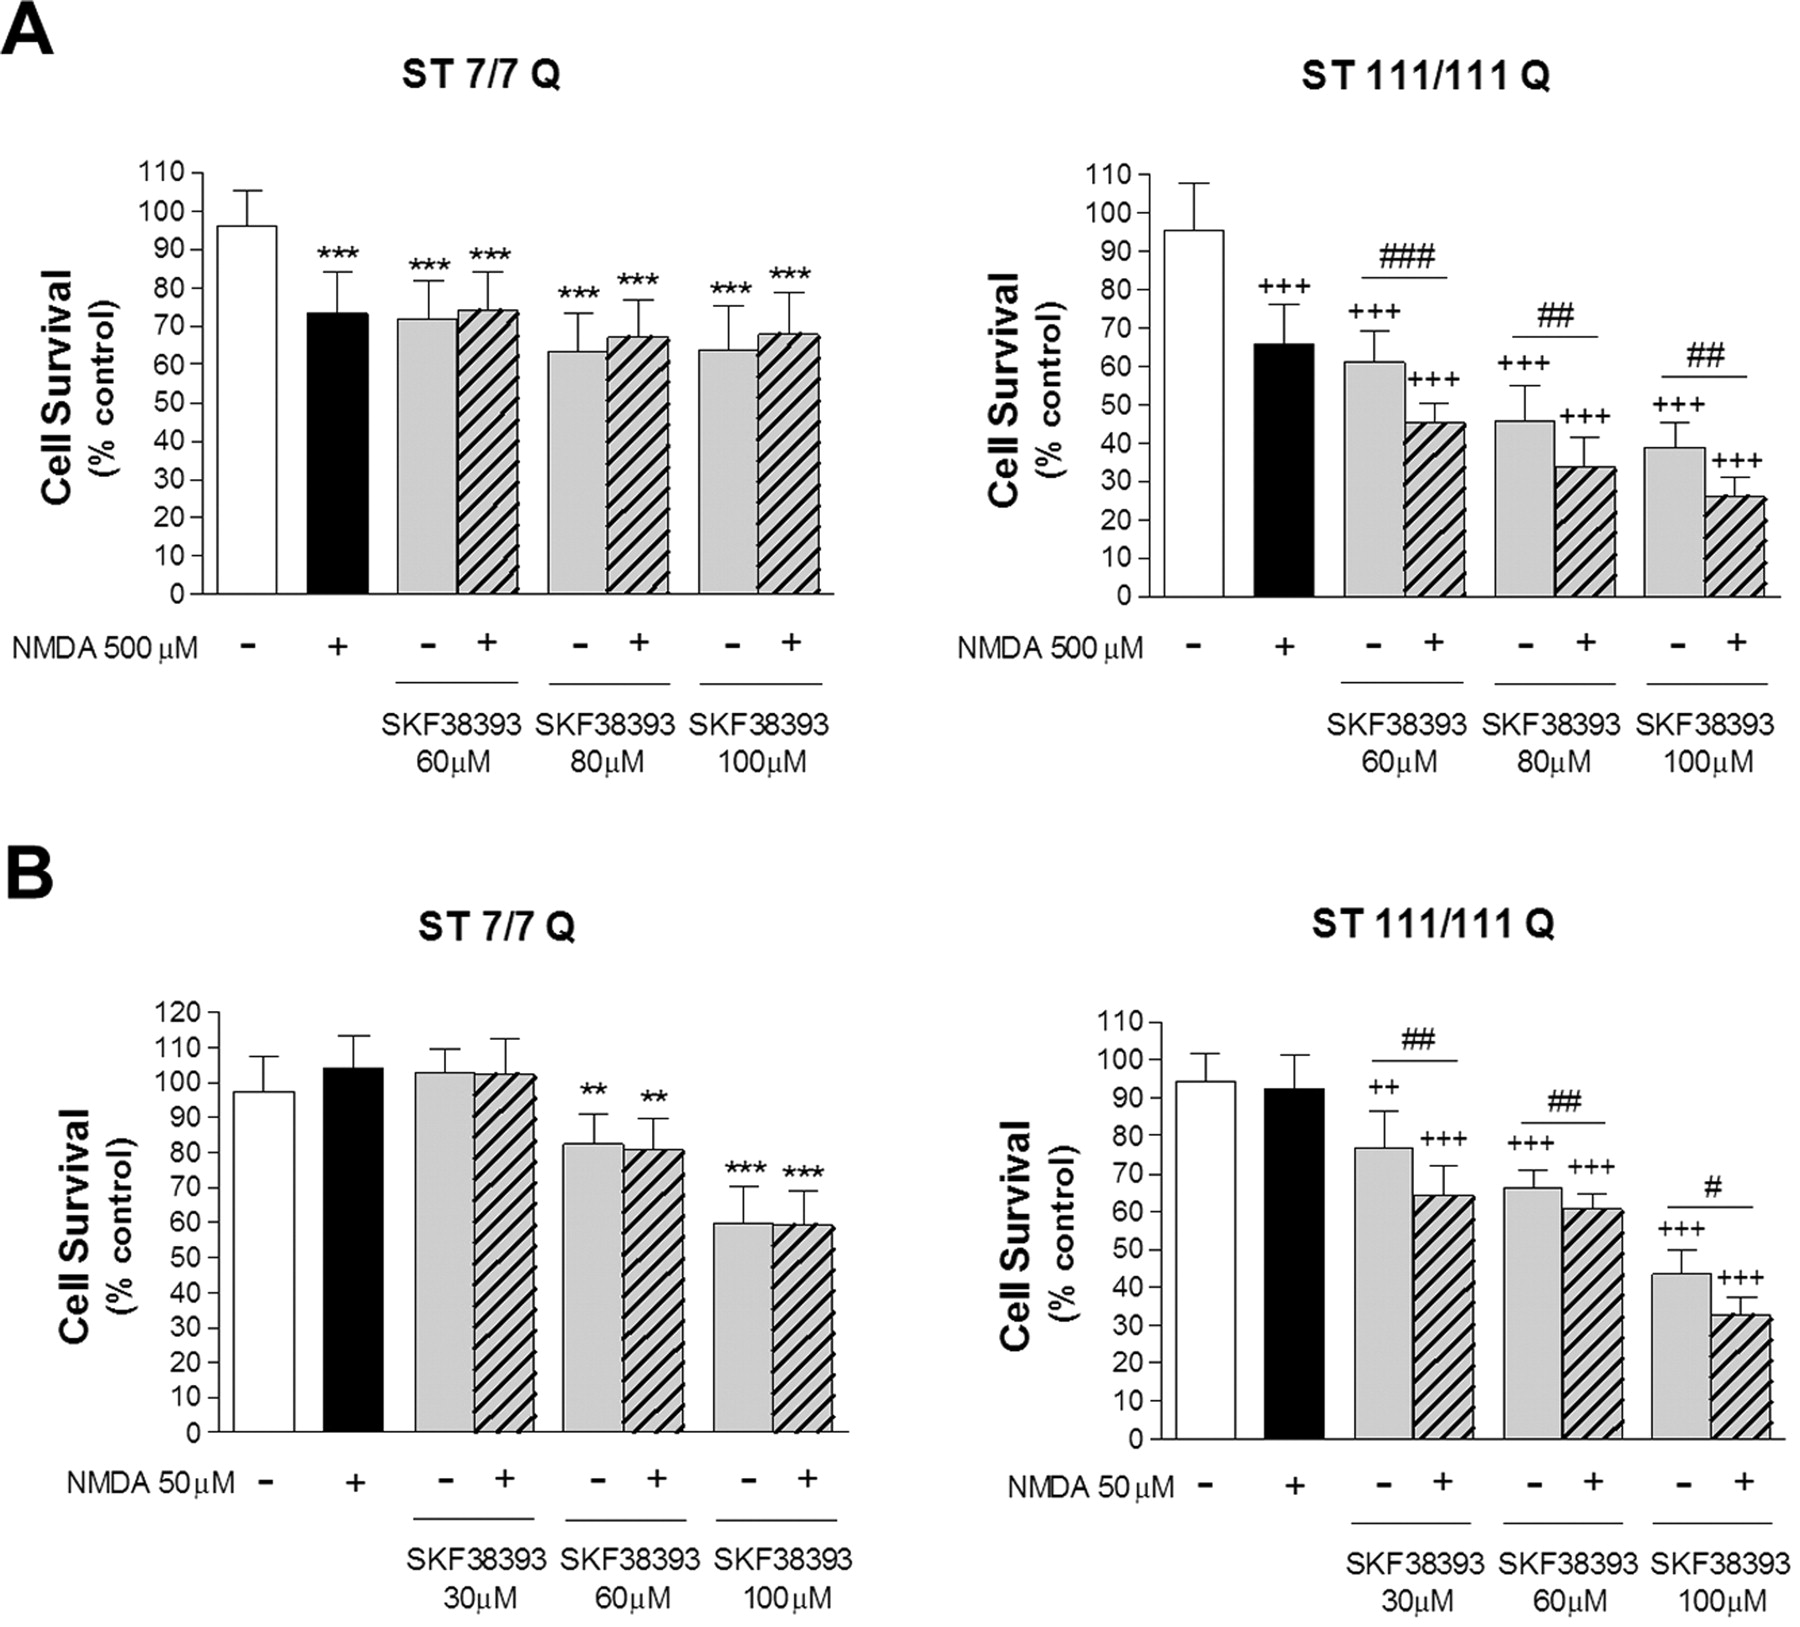
- Figure 2.
NMDA potentiates the toxic effect of D1-receptor activation in STHdhQ111 striatal cells. A, Wild-type (ST7/7Q) and mutant (ST111/111Q) striatal cells were treated with a toxic concentration of NMDA (500 μm) for 30 min before treatment with different concentrations of SKF38393 (60, 80, or 100 μm). Cell survival was assessed 24 h later by scoring the percentage of Hoechst-stained nuclei. B, Wild-type and mutant striatal cells were exposed to a subtoxic concentration of NMDA (50 μm) for 30 min before treatment with different concentrations of SKF38393 (30, 60, or 100 μm). Cell survival was measured 24 h later by scoring the percentage of Hoechst-stained nuclei. Forty fields were counted per condition per experiment, comprising at least 30–40 cells. Results are expressed as percentage of control (vehicle-treated) cells, and data are the mean ± SD of three independent experiments performed in triplicate. A full statistical analysis by the two-way ANOVA is described in the text. **p < 0.01, ***p < 0.001 treated versus vehicle-treated wild-type cells; ++p < 0.01, +++p < 0.001 treated versus vehicle-treated mutant cells; #p < 0.05, ##p < 0.01, ###p < 0.001 NMDA plus SKF38393-treated mutant cells versus SKF38393-treated mutant cells (Bonferroni's multiple comparison test).
- Figure 3.
JNK activation is not associated with NMDA and dopamine-mediated neurotoxicity in wild-type STHdhQ7 and mutant STHdhQ111 striatal cells. A, Representative Western blot showing levels of p-JNK, JNK, and α-tubulin as a loading control, from wild-type (ST7/7Q) and mutant (ST111/111Q) striatal cells treated with NMDA (500 μm) or SKF38393 (100 μm) alone, or preincubated with NMDA (30 min) before SKF38393 treatment. Total cell extracts were obtained 30 min after treatment. The histogram represents the relative p-JNK/JNK ratio expressed as fold increase versus control cells. Values are given as mean ± SD of three independent experiments. B, Wild-type (ST7/7Q) and mutant (ST111/111Q) striatal cells pretreated (1 h) with the JNK inhibitor SP600125 (10 μm) were exposed to NMDA (500 μm) or SKF38393 (100 μm) alone, or preincubated with NMDA before SKF38393 exposure. Cell survival was evaluated 24 h later by scoring the percentage of Hoechst-stained nuclei. Forty fields were counted per condition per experiment, comprising at least 30–40 cells. Results are expressed as percentage of control (vehicle-treated) cells, and data are the mean ± SD of three independent experiments performed in triplicate. ***p < 0.001 treated versus vehicle-treated wild-type cells; +++p < 0.001 treated versus vehicle-treated mutant cells as determined by one-way ANOVA followed by Bonferroni's multiple comparison test.
- Figure 4.
NMDA receptor activation potentiates D1R-induced Cdk5 phosphorylation in mutant STHdhQ111 cells. A, Representative Western blot showing levels of p-Cdk5, Cdk5, and α-tubulin as a loading control from wild-type (ST7/7Q) and mutant (ST111/111Q) striatal cells. B, Representative Western blot showing levels of p-Cdk5, Cdk5, and GFP and α-tubulin as a loading control from wild-type striatal cells transfected with different constructs encoding for enhanced fluorescent protein-tagged exon-1 mutant huntingtin protein with 23 (Q23), 72 (Q72), or 103 (Q103) CAG repeats. C–E, Representative Western blot showing levels of p-Cdk5, Cdk5, and α-tubulin as a loading control from wild-type (ST7/7Q) and mutant (ST111/111Q) cell extracts obtained after treatment with NMDA 500 μm (C), SKF38393 100 μm (D), or a pretreatment with NMDA before SKF38393 exposure (E). Total cell extracts were obtained at different time periods (5, 15, 30, and 60 min) after treatment. The histograms represent the relative p-Cdk5/Cdk5 ratio expressed as fold increase versus control (vehicle-treated) cells. Values are given as mean ± SD of five independent experiments. A full statistical analysis by the two-way ANOVA is described in the text. **p < 0.01, ***p < 0.001 treated versus vehicle-treated wild-type cells; +p < 0.05, ++p < 0.01, +++p < 0.001 treated versus vehicle-treated mutant cells; #p < 0.05, ##p < 0.01, ###p < 0.001 treated mutant cells versus treated wild-type cells (Bonferroni's multiple comparison test).
- Figure 5.
Increased p25/p35 levels in mutant STHdhQ111 striatal cells. A, Representative Western blot showing levels of p35, p25, and α-tubulin as a loading control from wild-type (ST7/7Q) and mutant (ST111/111Q) striatal cells. B, Representative Western blot showing α-spectrin and SDBP (150–160 kDa) and α-tubulin as a loading control from wild-type (ST7/7Q) and mutant (ST111/111Q) striatal cells. C, Representative Western blot showing levels of p35, p25, and α-tubulin as a loading control from wild-type and mutant striatal cells treated with MK-801 25 μm or EGTA 400 μm for 6 h. The histograms represent the relative p35 and p25 levels expressed as fold increase versus wild-type cells. Values are given as mean ± SD of three independent experiments. ***p < 0.001 mutant cells versus wild-type cells; ##p < 0.01, ###p < 0.001 treated versus vehicle-treated mutant cells as determined by one-way ANOVA followed by Bonferroni's multiple comparison test. D–F, Representative Western blot showing p35 and p25 levels and α-tubulin as a loading control from wild-type and mutant striatal cells treated with NMDA 500 μm alone (D), SKF38393 100 μm alone (E), or pretreated with NMDA before SKF38393 exposure (F). Total extracts were obtained at different time periods (5, 15, 30, and 60 min) after treatment. (n = 3 independent experiments).
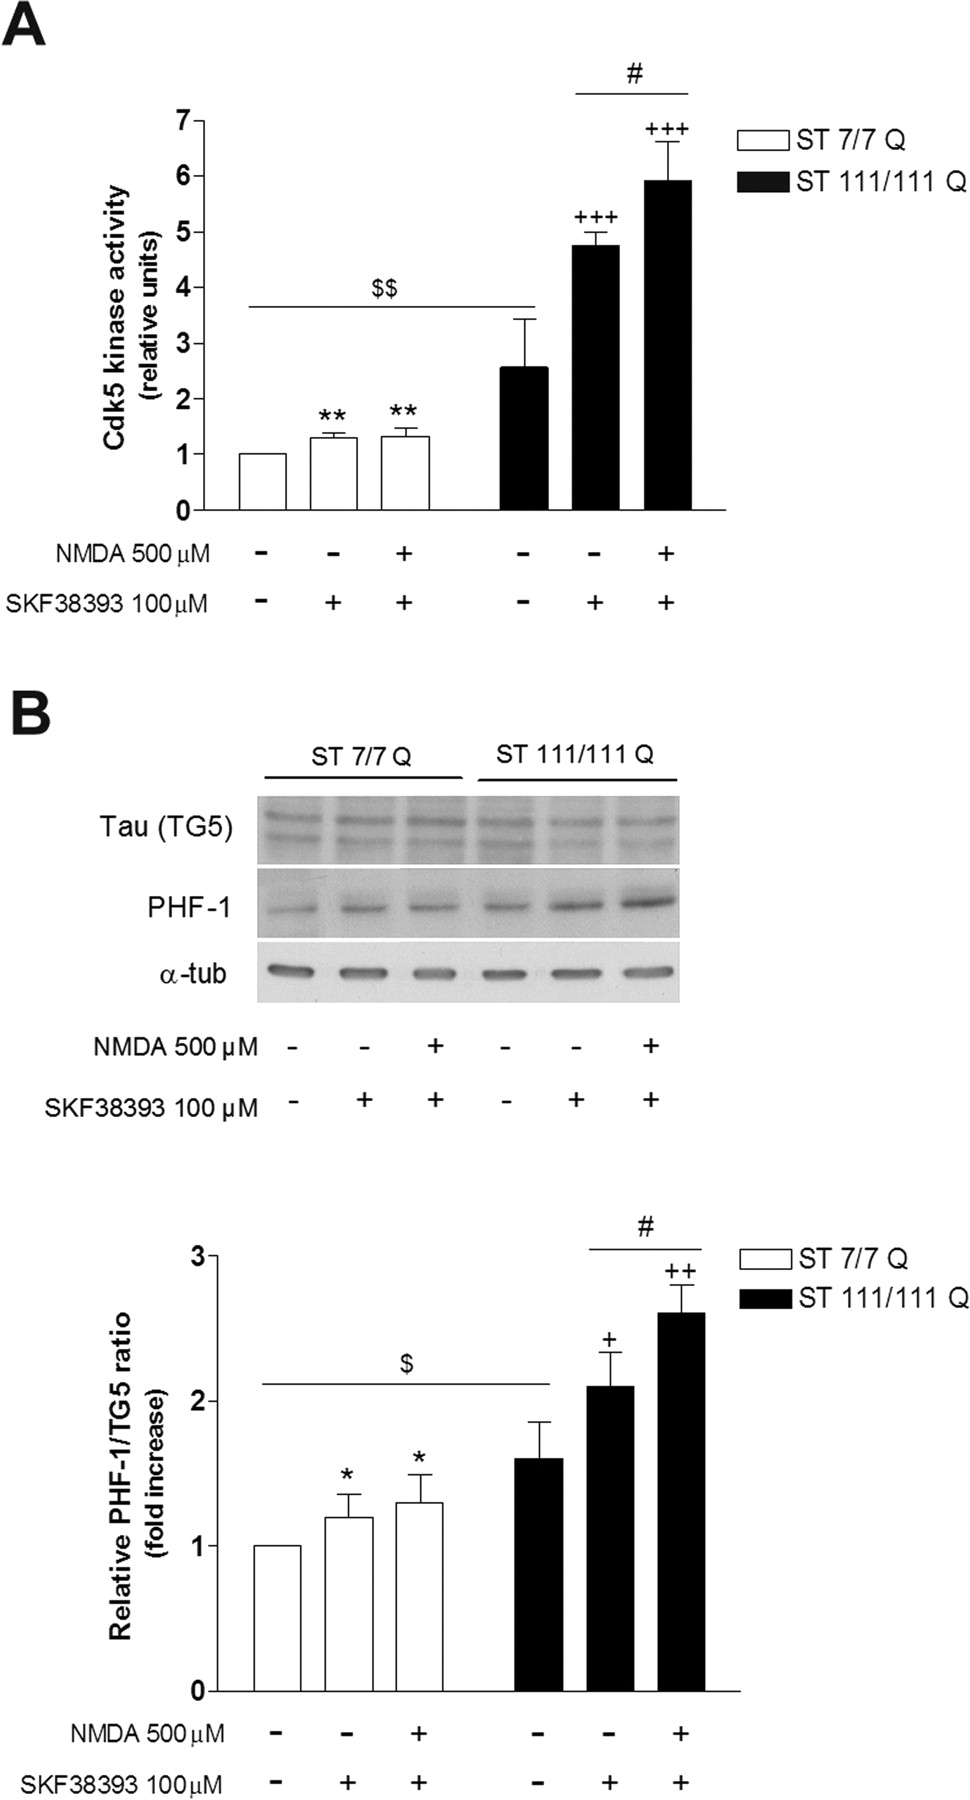
- Figure 6.
Mutant STHdhQ111 striatal cells exhibit increased Cdk5 activity associated with higher tau phosphorylation. Wild-type (ST7/7Q) and mutant (ST111/111Q) striatal cells were treated with SKF38393 (100 μm) or pretreated with NMDA (500 μm) before SKF38393 exposure, and total cell extracts were obtained 30 min after treatment. A, In vitro kinase assay of immunoprecipitated Cdk5 from 500 μg of whole-cell lysates was performed using H1 peptide as substrate. The histogram represents the Cdk5 kinase activity in relative units corrected for the protein levels of Cdk5 for each sample and refereed to control (vehicle-treated) wild-type cells. Values are given as mean ± SD of three independent experiments. **p < 0.01 treated versus vehicle-treated wild-type cells; +++p < 0.001 treated versus vehicle-treated mutant cells; $$p < 0.01 vehicle-treated mutant cells versus vehicle-treated wild-type cells; #p < 0.05 NMDA plus SKF38393-treated mutant cells versus SKF38393-treated mutant cells as determined by one-way ANOVA followed by Bonferroni's multiple comparison test. B, Representative Western blot showing total Tau (TG5) levels, phosphorylated Tau (PHF-1) levels, and α-tubulin as a loading control from wild-type and mutant striatal cells. The histogram represents the relative PHF-1/TG5 ratio expressed as fold increase versus wild-type cells. Values are given as mean ± SD of three independent experiments. *p < 0.05 treated versus vehicle-treated wild-type cells; +p < 0.05, ++p < 0.01 treated versus vehicle-treated mutant cells; $p < 0.05 vehicle-treated mutant cells versus vehicle-treated wild-type cells; #p < 0.05 NMDA plus SKF38393-treated mutant cells versus SKF38393-treated mutant cells as determined by one-way ANOVA followed by Bonferroni's multiple comparison test.
- Figure 7.
Inhibition of Cdk5 kinase activity by roscovitine ameliorates STHdhQ111 cells from cell death induced by SKF38393 and NMDA treatment. A, B, Wild-type (ST7/7Q; A) and mutant (ST111/111Q; B) striatal cells pretreated (1 h) with the Cdk5 inhibitor roscovitine (20 μm) were exposed to NMDA (500 μm) or SKF38393 (100 μm) alone, or preincubated with NMDA before SKF38393 exposure. Cell survival was evaluated 24 h later by scoring the percentage of Hoechst-stained nuclei. Forty fields were counted per condition per experiment, comprising at least 30–40 cells. Results are expressed as percentage of control (vehicle-treated) cells, and data are the mean ± SD of three independent experiments performed in triplicate. ***p < 0.001 treated versus vehicle-treated wild-type cells; $p < 0.05, $$$p < 0.001 roscovitine-treated versus roscovitine-untreated wild-type cells; +p < 0.05, +++p < 0.001 treated versus vehicle-treated mutant cells; #p < 0.05,###p < 0.001 roscovitine-treated versus roscovitine-untreated mutant cells as determined by one-way ANOVA followed by Bonferroni's multiple comparison test.
- Figure 8.
Cdk5 pathway is altered in HD knock-in mice and HD human brain. A, Representative Western blot showing levels of p-Cdk5, Cdk5, p35, p25, and α-tubulin as a loading control from striatal extracts of wild-type HdhQ7 and mutant HdhQ111 mice at 9 months of age. B, Representative Western blot showing levels of total Tau (TG5), phosphorylated Tau (PHF-1), and α-tubulin as a loading control from striatal extracts of wild-type HdhQ7 and mutant HdhQ111 mice at 9 months of age. Values are given as mean ± SD of three independent samples. **p < 0.01 as determined by Student's t test. C, Representative Western blot showing levels of total Cdk5, p35, p25, and α-tubulin as a loading control from human brain striatal samples of control (n = 3) and HD patients (n = 3). Scatter plots represent the relative levels of Cdk5, p35, and p25. The higher value obtained in control brain extracts was set as 1.
- Figure 9.
Increased sensitivity of mutant huntingtin striatal cells to glutamate and dopamine receptor activation involves enhanced Cdk5 activity. Hypothetical model to depict the link between neurotoxicity induced by dopamine and glutamate receptor activation and the Cdk5 pathway in HD. Enhanced activation of NMDAR and D1R induced by mutant huntingtin leads to deregulation of calcium homeostasis (Cepeda et al., 2001; Seong et al., 2005; Starling et al., 2005; Tang et al., 2007). Increased intracellular calcium in turn leads to higher calpain activity that results in enhanced cleavage of p35 into p25 (Lee et al., 2000). In addition, as our data demonstrate, activation of NMDAR may potentiate D1R-mediated phosphorylation of Cdk5 at Tyr15, which has been shown to regulate Cdk5-induced neurotoxicity (Lin et al., 2007). The generation of p-Cdk5/p25 complexes implies Cdk5 hyperactivation that is responsible for the phosphorylation of new substrates such as tau protein. Now, hyperphosphorylation of tau in concert with unknown yet down-stream p25/Cdk5 effectors might contribute to striatal cell death and dysfunction and therefore to HD neuropathology. The model is supported by the capacity of roscovitine, a Cdk5 inhibitor, to prevent cellular death induced by NMDAR and D1R activation.


