

Article Figures & Data
Figures
- Figure 1.
Microtubules are not protected from P60-katanin-induced severing by Taxol. A and E show expression of GFP–P60-katanin (in green), whereas B, D, and F show immunostains for microtubules. A, B, Two cells, only one of which is expressing GFP–P60-katanin. The nonexpresser shows a normal dense splayed microtubule array, whereas the expresser shows far less microtubule mass and only a scattering of very short microtubules. C, D, A cell not expressing GFP–P60-katanin but treated with Taxol. A portion of the microtubules appears as thick bundles. E, F, A cell expressing GFP–P60-katanin in the presence of Taxol. Note that the microtubule mass is severely reduced, and both bundled and unbundled microtubules are very short. Scale bar: (in F) A–F, 30 μm.
- Figure 2.
MAP2c protects microtubules from being severed by P60-katanin, but MAP1b does not. A, C, E, G, GFP–P60-katanin in green and immunostain for either plasmid-expressed MAP2 or MAP1b in red. B, D, F, H, Immunostains for microtubules. A, B, Cells that are not overexpressing P60-katanin. As shown in A and B, MAP1b expression does not cause abnormal bundling of microtubules. As shown in C and D, a cell overexpressing MAP1b and P60-katanin shows only a scattering of very short microtubules and severely reduced microtubule levels. (A neighboring cell not expressing MAP1b or P60-katanin displays a normal microtubule array). As shown in E and F, MAP2c expression causes the formation of dense bundles of microtubules. As shown in G and H, the microtubules in MAP2c-expressing cells show no indication of severing by overexpression of P60-katanin, and the microtubule mass is not reduced. Scale bar: A–H, 30 μm.
- Figure 3.
Results obtained with various tau constructs expressed together with P60-katanin. Cells in the top row were transfected with the tau constructs alone. Cells in the bottom row were transfected with the tau constructs together with P60-katanin. Four-repeat tau generates microtubule bundling (A) and no indication of microtubule severing (a). The microtubule-binding domain alone generates some bundling, but not as much as the four-repeat isoform (B), and provides some protection against severing (b), but not as much as the four-repeat or the three-repeat (not shown in figure) full-length versions of tau. Two versions of tau that lack the microtubule-binding domain, one naturally occurring (C, c) and one generated by experimental truncation (D, d), show no protection against severing. w/o, Without. Scale bar: (in d) 30 μm.
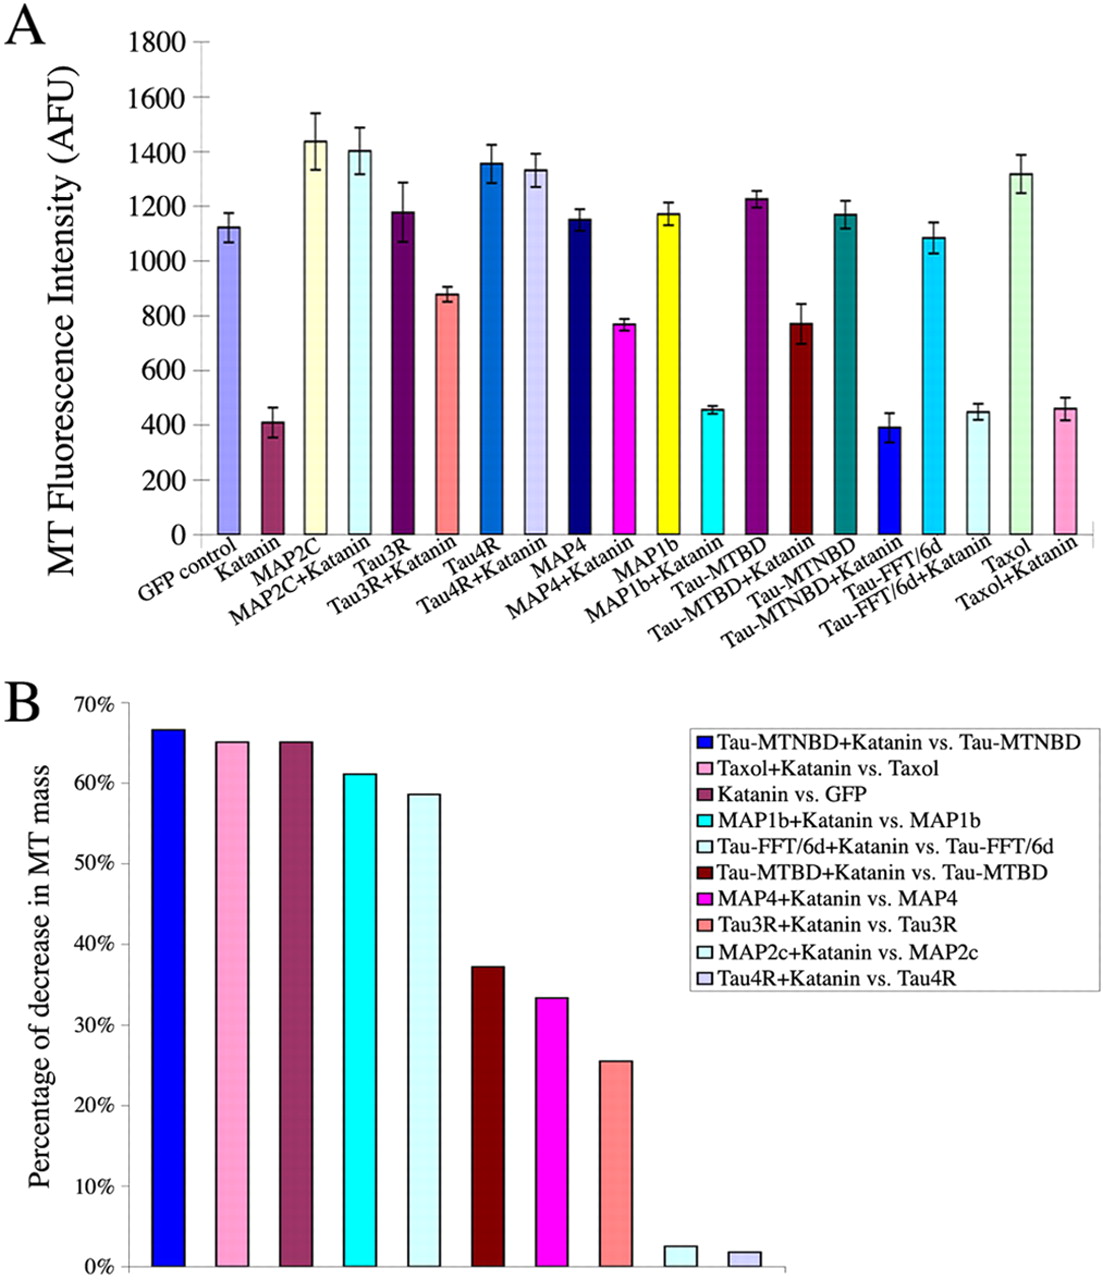
- Figure 4.
Quantitative analyses of microtubule mass in fibroblasts induced to overexpress katanin together with various MAP constructs. A, The quantitative data graphically on the average fluorescence intensity of microtubule total mass. GFP (GFP alone as the control); katanin (P60-katanin alone); Taxol (control cells cultured in Taxol-containing medium); Taxol plus katanin (P60-katanin transfected cells cultured in Taxol-containing medium); MAP2c (MAP2c alone); MAP2c plus katanin (the cells expressing MAP2c and P60-katanin); MAP1b (MAP1b alone); MAP1b plus katanin (cells expressing MAP1b and P60-katanin); MAP4 (MAP4 alone); MAP4 plus katanin (cells expressing MAP4 and P60-katanin); tau3R (tau-3R alone); tau3R plus katanin (cells expressing tau3R and P60-katanin); tau4R (cells expressing tau4R alone); tau4R plus P60-katanin (cells expressing tau4R and P60-katanin); tauMTBD (tauMTBD alone); tauMTBD plus katanin (cells expressing tauMTBD and P60-katanin); tauMTNBD (tauMTNBD alone); tauMTNBD plus katanin (cells expressing tauMTNBD and P60-katanin); tauFFT/6d (tauFFT/6d alone); tauFFT/6d plus katanin (cells expressing tauFFT/6d and P60-katanin). B, Bar graph showing calculations on the percentage diminution in microtubule mass in cells with the various treatments (MAP expression, Taxol, GFP alone) as a result of expression of P60-katanin, from high to low. Error bars represent SE. MT, Microtubule; AFU, arbitrary fluorescence units.
- Figure 5.
Quantitative analysis of MAP levels after treatment with siRNAs. Control siRNA and siRNAs to MAP2, MAP1b, and tau were transfected into hippocampal neurons. Cultures were fixed 1, 3, and 5 d, respectively, after transfection and immunostained for each MAP to evaluate its level as a result of the siRNA. Immunofluorescence indicates depletion of MAP2, MAP1b, and tau in siRNA-treated neurons (b, d, f), compared with control siRNA-treated neurons (B, D, F), is shown. A, C, E, The quantification of total fluorescence intensity within the soma revealing the progressive loss of MAP2, MAP1b, and tau depletion by siRNA. By day 5, the loss of MAP2, MAP1b, and tau in siRNA treated neurons are 95, 99, and 99%, respectively. G, Western blot of whole-cell extracts probed with the MAP2, MAP1b, and tau Ab, confirming the protein-lowering effect. GAPDH was used as the internal control. Error bars represent SE.
- Figure 6.
Effects of depleting MAP2, MAP1b, and tau on the development of hippocampal neurons in culture. Hippocampal neurons were divided into four groups, treated with control siRNA or siRNA to MAP2, MAP1b, or tau, respectively. Replating of neurons was done 2 d after siRNA treatment. Two days after replating, neurons were fixed and stained for microtubules. A, Pie graphs for the ratio of stage I, II, and III hippocampal neurons in each group. There is no significant difference between the control group and the groups depleted of MAP2 or tau. In contrast, depleting MAP1b delayed their development (p < 0.01). B, The quantitative analysis of the lengths of minor processes and axons of neurons in each group. Compared with the control, the axonal lengths of neurons treated with MAP2, MAP1b, and tau siRNA are shorter (p < 0.01). The axonal length of neurons treated with MAP1b siRNA is the shortest among these three. C, The quantitative analysis of the minor process length of neurons in each group. No significant difference was discovered between either two groups (p > 0.05). D, The quantitative analysis of microtubule mass in cell bodies in each group. Only the depletion of MAP1b resulted in a diminution of microtubule levels (by 21%). The microtubule levels in the other MAP siRNA-treated groups were not reduced. 1, 2, 3, 4 in B–D are control siRNA-treated, MAP2-siRNA treated, MAP1b siRNA-treated, and tau siRNA-treated group, respectively. Error bars represent SE. MT, Microtubule; AFU, arbitrary fluorescence units.
- Figure 7.
Depletion of tau from cultured hippocampal neurons increases sensitivity to katanin-induced microtubule severing, whereas depletion of MAP1b or MAP2 does not. A–F, Microtubule immunostains of stage III hippocampal neurons. A, A neuron transfected with control siRNA and GFP. B, A neuron transfected with control siRNA and P60-katanin. C, A neuron transfected with MAP1b siRNA and GFP. D, A neuron transfected with MAP1b siRNA and P60-katanin. E, A neuron transfected with tau siRNA and GFP (axon is directed upwards in the panel). F, A neuron transfected with tau siRNA and P60-katanin. Note that the axons show no diminution in fluorescence intensity as a result of overexpression of P60-katanin in either control siRNA or MAP1b siRNA-treated neurons. However, a dramatic diminution was detected in tau-depleted neurons overexpressing P60-katanin. a–f, Glow-scale pseudocolored images of the axons in A–F, with white indicating the highest level, purple indicating the lowest level, and shades of red, orange, and yellow indicating intermediate levels. G, The quantification of microtubule mass in cell bodies, in minor processes, and in axons of stage III neurons in each group. Overexpression of P60-katanin in either control group or the three MAP siRNA-treated groups leads to a 33–40% diminution in microtubule mass from cell bodies (p < 0.01). Overexpression of P60-katanin in either control group or the three MAP siRNA-treated groups leads to a 60–71% diminution in microtubule mass from minor processes (p < 0.0001). The microtubules in axons of tau depleted neurons were very sensitive to overexpression of P60-katanin, leading to a 63% diminution (p < 0.001). The microtubules in axons of the other three groups showed no diminution as a result of the overexpression of P60-katanin (p > 0.05). Error bars represent SE. AFU, Arbitrary fluorescence units; Kat, katanin.


