

Article Figures & Data
Figures
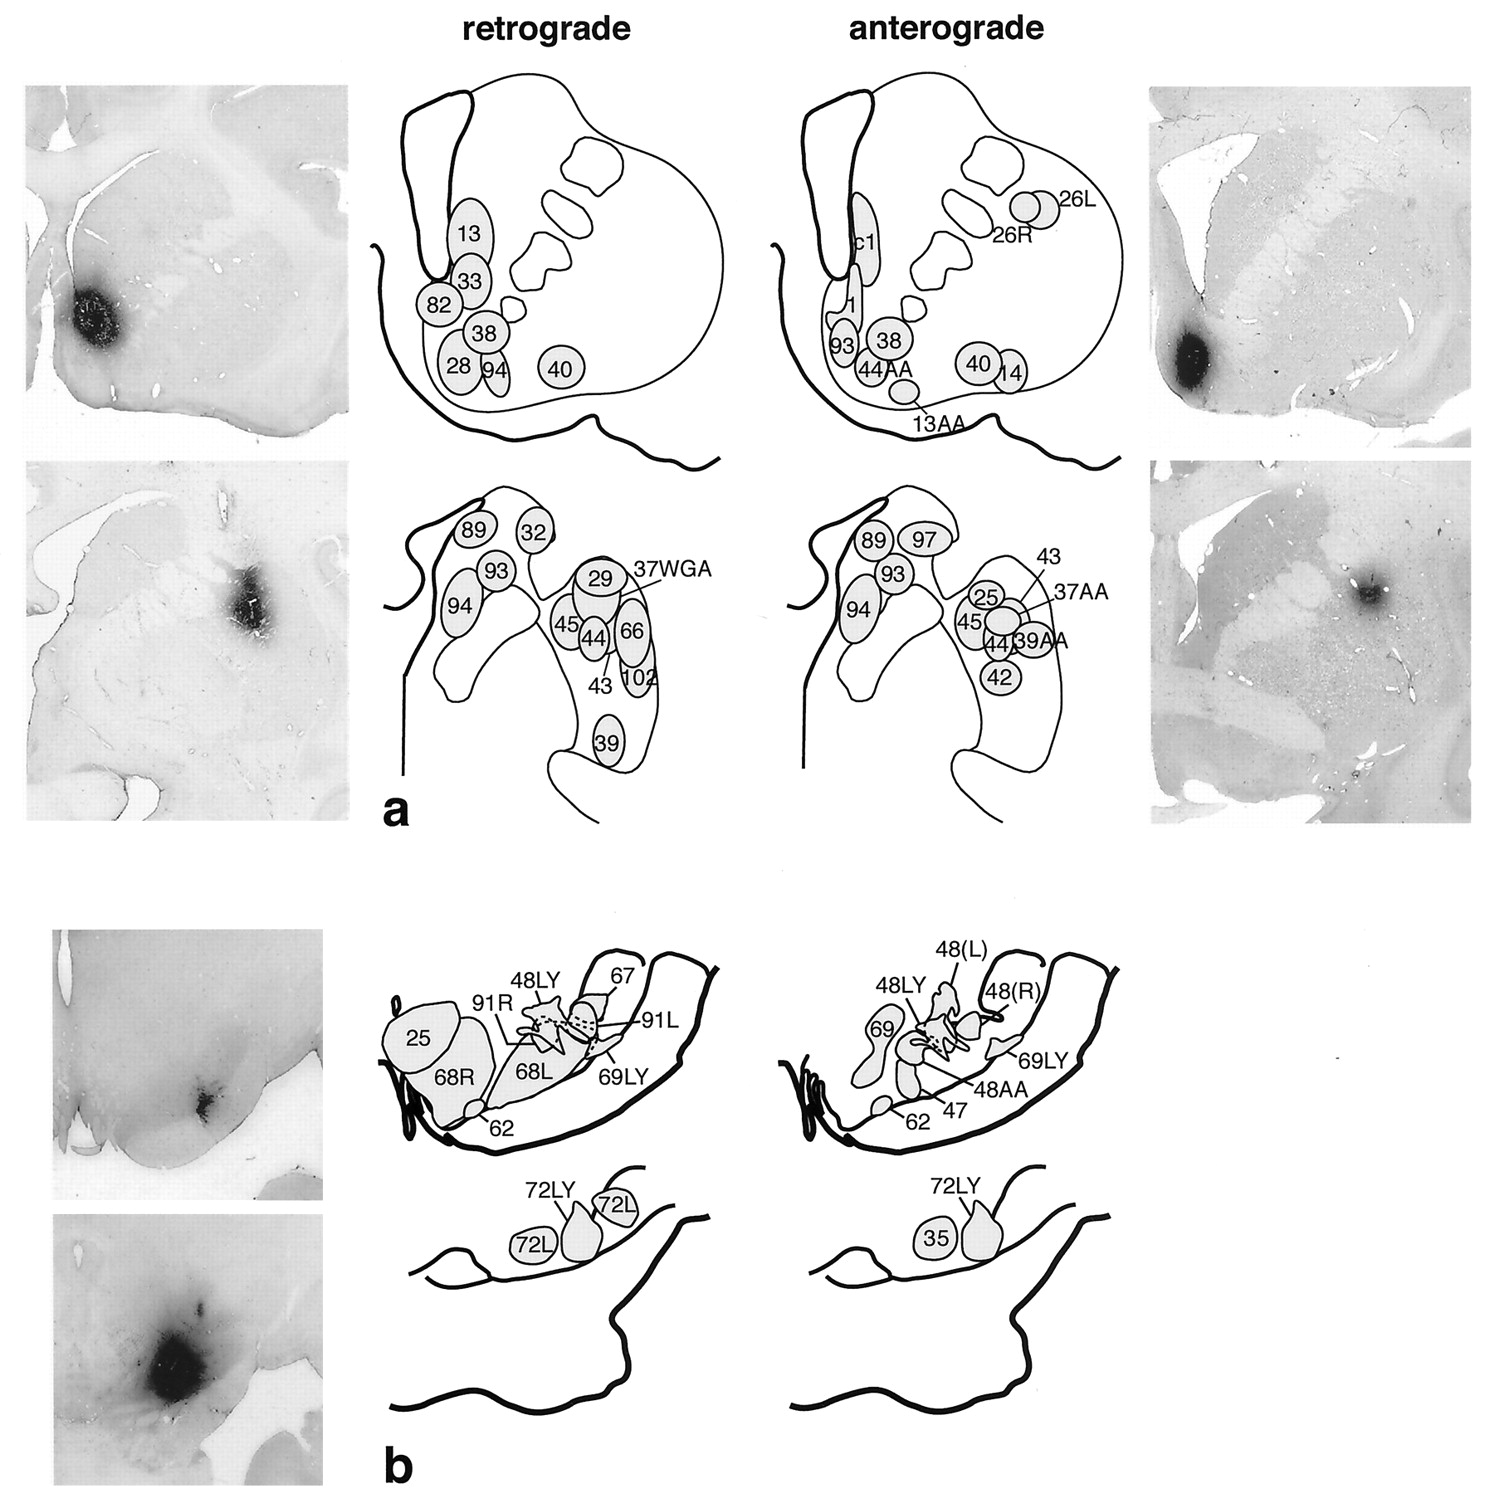
- Fig. 1.
a, Summary of retrograde and anterograde striatal injections. Bi-directional tracer injection sites are shown on both anterograde and retrograde drawings. Photomicrographs are examples of individual injection sites at caudal and rostral levels of the striatum. b, Summary of retrograde and anterograde injections in the substantia nigra. Bi-directional tracers are used in both anterograde and retrograde injection sites. Photomicrographs are examples of individual injection sites at caudal and rostral levels of the substantia nigra.
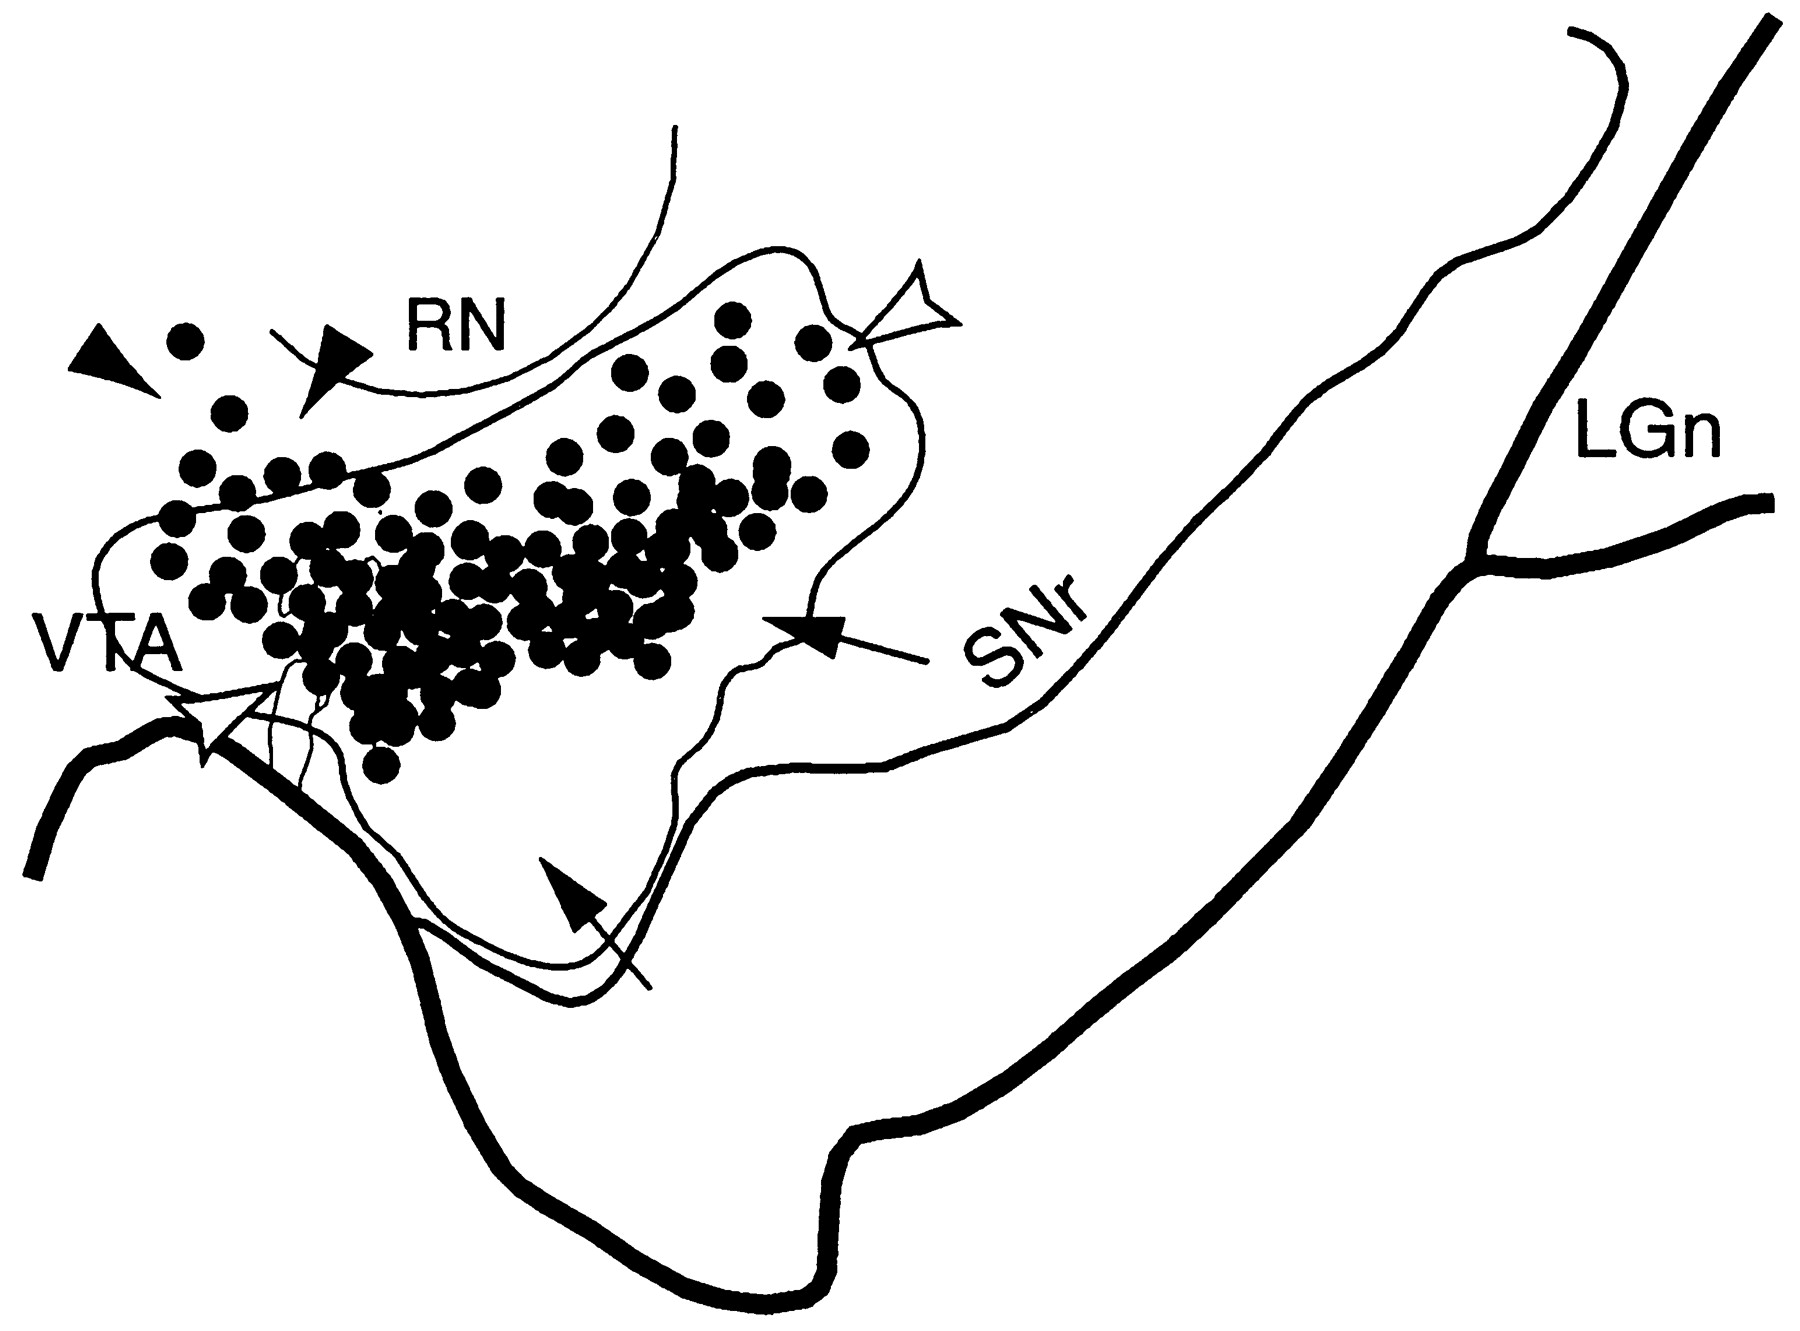
- Fig. 2.
Schematic of the substantia nigra showing the combined distribution of terminal labeling (outlined area) and retrogradely labeled cells (black dots; each = 4–6 cells) after all VMS tracer injections. Black arrowheads indicate cells dorsal to VMS terminals. White arrowheads point to cells within the terminal field. Arrows indicate a ventral terminal region without cells that project to the VMS. LGn, Lateral geniculate nucleus; RN, red nucleus;SNr, substantia nigra, pars reticulata;VTA, ventral tegmental area.
- Fig. 3.
The shell SNS projection system illustrating the three components within the midbrain. a, Schematic of the midbrain showing the combined distribution of labeled terminals (outline) and cells (black stars; each = 4–6 cells) after all shell tracer injections. Black arrowheads indicate cells dorsal to terminals, white arrowheads indicate the region of cells within the shell terminal field, and arrows point to terminals ventral and lateral to cells projecting to the shell. b, Photomicrograph taken from the region outlined in a(box) of labeled cells after a WGA-HRP injection into the dorsal shell or cone region (case 82). c, Dark-field photomicrograph of the midbrain showing the distribution of terminals (silver grains) after a tritiated amino acid injection into the dorsal shell (injection site shown at right) (case 93AA). Note that some terminals extend into the dorsal part of the densocellular region (arrows). d, Schematic comparing the distribution of labeled cells from collective shell injections (stars) with those from collective core injections (open circles). One star or circle = 4–6 cells.LGn, Lateral geniculate nucleus; RN, red nucleus; SNr, substantia nigra, pars reticulata;VTA, ventral tegmental area.
- Fig. 4.
The core SNS projection system illustrating three components within the midbrain (Case 33). a, Schematic of the midbrain showing the combined distribution of labeled terminals (outline) and cells (circles; each = 4–6 cells) after all core tracer injections. Black arrowheads indicate labeled cells dorsal to terminals,white arrowheads indicate cells among terminals from the core, and arrows point to terminals ventral to cells projecting to the core. b–d, Photomicrographs of the three SNS projection components after an individual LY injection into the core. Boxed regions in a represent the approximate location of each photomicrograph from individual cases.b, Labeled cells not among terminals that project to the core. c, Labeled cells among labeled terminals.d, Dark-field photomicrograph of labeled efferent terminals in a region devoid of cells projecting to the core.LGn, Lateral geniculate nucleus; RN, red nucleus; SNr, substantia nigra, pars reticulata;VTA, ventral tegmental area.
- Fig. 5.
Shell efferent projections overlap midbrain cells projecting to the core. a, Schematic of the midbrain illustrating the distribution terminals from the shell (outline) and cells that project to the core (circles; each = 4–6 cells) from collective tracer injections into the shell and core, respectively. b, Dark-field photomicrograph showing labeled terminals (silver grains), after an injection of tritiated amino acids in the shell, overlaying cells (arrows) in the midbrain region indicated by thebox in a. c, Core efferent projections do not overlap midbrain cells projecting to the shell. Schematic of the midbrain depicting the combined distributions of cells projecting to the shell (stars; each = 4–6 cells) and terminals from the core (outline) after collective injections into the shell and core, respectively. LGn, Lateral geniculate nucleus; RN, red nucleus;SNr, substantia nigra, pars reticulata;VTA, ventral tegmental area.
- Fig. 6.
The central and dorsolateral SNS projection systems illustrating three components within the midbrain (cases 93 and 43, respectively). In schematics, black arrowheadsindicate labeled cells dorsal and medial to terminals, white arrowheads indicate labeled cells among labeled terminals, andarrows point to terminals ventral to labeled cells.Boxed regions represent the approximate location of each photomicrograph from individual cases. a, Schematic of the midbrain showing the combined distribution of labeled terminals (outline) and cells (diamonds; each = 4–6 cells) after all CS tracer injections. b–d, Dark-field photomicrographs of the three central SNS projection components after an individual LY injection into the CS.b, Labeled cells, not among terminals that project to the CS. c, Labeled cells among labeled CS efferent terminals. d, Labeled CS efferent terminals in a region devoid of cells that project to CS. e, Schematic of the midbrain showing the combined distribution of labeled terminals (outline) and cells (dots; each = 4–6 cells) after all DLS tracer injections. f–h, Photomicrographs of the three SNS projection components after an LY injection into the DLS. f, Labeled cells, not among labeled terminals that project to the DLS. Dark-field images of cells (g, arrows) among labeled DLS efferent terminals. h, DLS efferent terminals in a region devoid of retrogradely labeled cells. LGn, Lateral geniculate nucleus; RN, red nucleus;SNr, substantia nigra, pars reticulata;VTA, ventral tegmental area.
- Fig. 7.
Relationship between the VMS and DLS SNS projection systems in the midbrain. a, Schematic of the midbrain illustrating the combined distributions of terminal fields (outlines) from collective VMS and DLS tracer injections. b, Schema comparing the combined distributions of labeled cells from collective VMS (open circles) and DLS (filled circles) injections. One filled/open circle = 4–6 cells. c, Schema showing the combined distribution of labeled cells after all DLS injections in relation to VMS and DLS terminal fields (outlines). d, Dark-field photomicrograph, taken from the boxed region inc, of labeled cells (arrows) embedded in terminals (silver grains) after WGA-HRP and tritiated amino acid injections into the DLS and VMS, respectively. e, Bright-field photomicrograph of a retrogradely labeled neuron, which projects to the DLS, surrounded by PHA-L-labeled fibers (arrowheads) with terminal boutons from the VMS.f, Schema showing the distribution of labeled cells for collective VMS injections in relation to DLS terminals.LGn, Lateral geniculate nucleus; RN, red nucleus; SNr, substantia nigra, pars reticulata;VTA, ventral tegmental area.
- Fig. 8.
VMS–CS–DLS cell and terminal overlap in the midbrain. a, Schematic of the midbrain comparing the combined distribution of labeled terminals (outline) from all VMS tracer injections with that of cells (diamonds; each = 4–6 cells) that project to the CS. b, Schema comparing the combined distribution of labeled terminals (outline) from all CS tracer injections with that of cells (open circles; each = 4–6 cells) that project to the VMS. c, Schema comparing the combined distribution of labeled CS terminals (outline) with that of cells (black circles; each = 4–6 cells) that project to the DLS.LGn, Lateral geniculate nucleus; RN, red nucleus; SNr, substantia nigra, pars reticulata;VTA, ventral tegmental area.
- Fig. 9.
a, Collective distribution of labeled cells in the precommissural and postcommissural striatum after retrograde injections into the midbrain. Rostral (top) and caudal (bottom) drawings of the midbrain showing the location of retrograde injection sites. Shading of sites corresponds to that of the cells in the striatal schematics. One dot = 4–6 cells. b, Magnified view of VMS illustrates the distribution of labeled cells at the border between the core and shell after injections into the medial SN (open circles) and VTA (stars). c, Combined chartings of terminal/fiber distributions in the striatum after all anterograde tracer injections into the midbrain. Note that fibers are distributed throughout the DLS and CS, whereas the VMS receives a more limited projection. d, Schematic of the rostral striatum showing the distribution of labeled cells and fibers after an injection of the bi-directional tracer LY into the densocellular region of the SN (Case 48LY). Note that LY-positive cells are primarily in the VMS and CS, whereas labeled fibers are primarily seen in the CS and DLS.e, Dark-field photomicrograph taken from theboxed CS region in d showing dense LY-positive fibers, but no labeled cells. f, Photomicrograph taken from the boxed region in the VMS of labeled cells (from the boxed region ind).
- Fig. 10.
Schematic of the ventral midbrain, with photomicrographs from individual cases in which bi-directional tracers were placed in the VMS (a, case 33), CS (b, case 89), and DLS (c, case 102). Photomicrographs show the different positions of each SNS subcircuit. The VMS circuit (a) is located in a medial position with labeled cells in the dorsal region. The CS circuit (b) is located in a central position, with the labeled cells located in the densocellular region. The DLS circuit (c) is located laterally, with the labeled cells primarily ventral to the CS cells, extending deep into the cell columns. The three components of SNS for each region are also indicated: black arrowheads = labeled cells outside efferents fibers, white arrowheads = labeled cells within the terminal field of labeled efferent fibers, andarrows = labeled fibers that project ventral to labeled cells.
- Fig. 11.
Diagram of the three SNS components for each striatal region illustrating an overlapping and interdigitating system in the midbrain. The three midbrain components for each striatal region are represented by three ovals. The first oval in each set corresponds to the region of midbrain cells dorsal to its reciprocal afferent projection. The second oval corresponds to the region of cells within its reciprocal afferent projection. The third oval corresponds to the ventral region of nonreciprocal terminals that overlaps with cells of a more dorsal SNS system. Note that the third midbrain component of a striatal region overlaps the first component of the adjacent dorsal striatal region, resulting in stepwise feedforward projection from ventral to dorsal striatal regions.
- Fig. 12.
Diagram of the organization of SNS projections. The colored gradient in rostral and caudal schematics of the striatum illustrates the organization of functional corticostriatal inputs (red = limbic, green = associative, blue = motor). The shell receives forebrain input primarily from the amygdala, hippocampus, and cortical areas 25 and Ia. The core receives input from the entire OMPFC. The dorsolateral prefrontal cortex projects to the central striatum and premotor and motor cortex projects to the dorsolateral striatum. Midbrain projections from the shell target both the VTA and ventromedial SNc (red arrows). Midbrain projections from the VTA to the shell form a “closed,” reciprocal SNS loop (red arrow). Projections from the medial SN feedforward to the core forming the first part of a spiral (orange arrow). The spiral continues through the SNS projections (yellow and green arrows) with pathways originating in the core and projecting more dorsally (blue arrows). In this way ventral striatal regions influence more dorsal striatal regions via spiraling SNS projections.Magnified oval region shows a hypothetical model of the synaptic interactions of SNS projections in reciprocal versus feedforward loops. The reciprocal component (red arrows) of each limb of the SNS projection terminates directly (a) on a dopamine cell, resulting in inhibition. The nonreciprocal, or feedforward, component (orange arrow) terminates indirectly (b) on a dopamine cell via a GABAergic interneuron (brown cell), resulting in disinhibition and facilitation of dopaminergic cell burst firing. DL-PFC, Dorsolateral prefrontal cortex; IC, internal capsule;OMPFC, orbital and medial prefrontal cortex;S, shell; SNc, substantia nigra, pars compacta; SNr, substantia nigra, pars reticulata;VTA, ventral tegmental area.


Tables
- Table 1.
Summary of the relative density of labeled cells in frontal cortical areas after retrograde injections into the VMS, CS, and DLS striatum
Cortical area Ventromedial cases (case#) Central cases (case #) Dorsolateral cases (case #) 82 28 33 13 94W 38 35 94L 96 89 32 39 45 43 44 29 37 66L 102 4 − − − − − − − − − − − − + + ++ +++ ++++ ++++ ++++ 6 − − − − − − − − + ++ +++ +++ +++ ++++ ++++ ++++ ++ + + 24c − − − − − − − − + + − ++ + + + ++ + + +++ 8 − − − − − − − + ++++ +++ − − + − − − − − − 9 − − − − − − − + + +++ − − − − − − − − − 45/46 − − − − − − + + +++ +++ − − − − − − − − − 12 − + ++ ++ ++ +++ ++ +++ ++ ++ − − − − − − − − − 11 − − +++ ++ − ++++ + + − − − − − − − − − − − 13 − − + − ++ ++++ ++ + − + − − − − − − − − − 13a/b − ++ ++ ++++ ++ ++ + − − − − − − − − − − − − 24a/b − ++++ ++++ ++++ ++ ++++ +++ − − ++ + − − − − − − − − 32 + ++++ ++++ ++++ + ++ +++ − − + − − − − − − − − − 14 ++ ++ ++ ++ ++ + − − − + − − − − − − − − − Ia ++++ +++ ++ +++ ++ ++ − − − − − − − − − − − − − 25 ++++ ++++ ++++ ++++ + ++ ++ − − − − − − − − − − − − This summary is based on relative densities of labeled neurons in each frontal cortical area as seen in representative coronal sections (1.2 mm apart), where − represents few to no retrogradely labeled cells observed and + to ++++ represent increasing relative densities.


