

Abstract
Lesions in the medial forebrain bundle rostral to a stimulating electrode have variable effects on the rewarding efficacy of self-stimulation. We attempted to account for this variability by measuring the anatomical and functional effects of electrolytic lesions at the level of the lateral hypothalamus (LH) and by correlating these effects to postlesion changes in threshold pulse frequency (pps) for self-stimulation in the ventral tegmental area (VTA). We implanted True Blue in the VTA and compared cell labeling patterns in forebrain regions of intact and lesioned animals. We also compared stimulation-induced regional [14C]deoxyglucose (DG) accumulation patterns in the forebrains of intact and lesioned animals. As expected, postlesion threshold shifts varied: threshold pps remained the same or decreased in eight animals, increased by small but significant amounts in three rats, and increased substantially in six subjects. Unexpectedly, LH lesions did not anatomically or functionally disconnect all forebrain nuclei from the VTA. Most septal and preoptic regions contained equivalent levels of True Blue label in intact and lesioned animals. In both intact and lesioned groups, VTA stimulation increased metabolic activity in the fundus of the striatum (FS), the nucleus of the diagonal band, and the medial preoptic area. On the other hand, True Blue labeling demonstrated anatomical disconnection of the accumbens, FS, substantia innominata/magnocellular preoptic nucleus (SI/MA), and bed nucleus of the stria terminalis. [14C]DG autoradiography indicated functional disconnection of the lateral preoptic area and SI/MA. Correlations between patterns of True Blue labeling or [14C]deoxyglucose accumulation and postlesion shifts in threshold pulse frequency were weak and generally negative. These direct measures of connectivity concord with the behavioral measures in suggesting a diffuse net-like connection between forebrain nuclei and the VTA.
- brain stimulation reward
- medial forebrain bundle
- [14C]deoxyglucose autoradiography
- True Blue
- lateral hypothalamic lesions
- VTA stimulation
- reward pathway
- self-stimulation
The rewarding effects of electrical stimulation of the medial forebrain bundle (MFB) appear to be mediated by long, myelinated fibers coursing between the forebrain and the midbrain. Low-threshold self-stimulation sites cluster along the length of the MFB and continue into the ventral tegmentum (Olds et al., 1960;Corbett and Wise, 1980; Gratton and Wise, 1983; Forgie and Shizgal, 1993). Rewarding stimulation elevates metabolic activity along the MFB, between the ventral tegmental area (VTA) and the nucleus of the diagonal band (Gallistel et al., 1985). Psychophysical experiments demonstrate axonal linkages between rewarding sites in the lateral preoptic area (LPO), lateral hypothalamus (LH), and VTA (Shizgal, 1989). Pharmacological investigations implicate dopaminergic projections from the VTA to the nucleus accumbens in brain stimulation reward (BSR) (Wise and Rompré, 1989). One model of the reward circuitry proposes that the directly stimulated reward fibers originate in the basal forebrain, descend through the MFB, and synapse on dopaminergic cells in the VTA. These activated VTA neurons then send ascending projections through the MFB to the nucleus accumbens (Yeomans, 1982; Wise and Bozarth, 1984; Bielajew and Shizgal, 1986;Yeomans et al., 1993).
Identification of the specific MFB projections mediating BSR has been hampered by the inability of MFB lesions to consistently reduce the rewarding efficacy of brain stimulation (Huston and Borbely, 1974;Carey, 1982; Huston, 1982; Stellar and Neely, 1982; Colle and Wise, 1987; Janas and Stellar, 1987; Waraczynski, 1988; Murray and Shizgal, 1991; Johnson and Stellar, 1994). Lesions made through the stimulating electrode itself consistently produce large, enduring, and size-dependent decreases in rewarding efficacy (Gallistel et al., 1996). By contrast, lesions in the MFB rostral to the site of stimulation have produced variable effects on rewarding efficacy. Moreover, there has been a puzzling overlap between the size and location of lesions that caused significant reductions in rewarding efficacy and those that failed to affect reward thresholds (Stellar and Neely, 1982; Colle and Wise, 1987; Janas and Stellar, 1987;Waraczynski, 1988; Murray and Shizgal, 1991; Johnson and Stellar, 1994;Arvanitogiannis et al., 1996b; Gallistel et al., 1996; Murray and Shizgal, 1996b).
We hypothesized that variability in the behavioral effects of rostral MFB lesions results from variability in the effects of the lesions on forebrain–midbrain connectivity. We tested this hypothesis by directly assessing the extent to which LH lesions structurally and functionally disconnected the VTA from forebrain nuclei. Although the anatomy of MFB projections has been well mapped (Nieuwenhuys et al., 1982; Veening et al., 1982), no previous study has combined tract tracing with lesions and behavioral measures of BSR. We chose True Blue, a retrograde tracer taken up by fibers of passage, to assess the structural integrity of projections from cell bodies in the forebrain to a ventral tegmental stimulation site after a lateral hypothalamic lesion (Swanson, 1983). The activation of forebrain sites by MFB stimulation has been well established by [14C]deoxyglucose (DG) autoradiographic studies with intact animals (Yadin et al., 1983;Esposito et al., 1984; Porrino et al., 1984, 1990; Gallistel et al., 1985). However, no previous study has combined any functional imaging technique with lesions and behavioral measurements. We used [14C]DG to assess the extent to which LH lesions would alter the normal patterns of forebrain activation by VTA stimulation.
MATERIALS AND METHODS
Subjects. Twenty-two male Sprague Dawley rats were used in the True Blue experiment; 27 were used in the [14C]DG experiment. All experimental protocols were approved by the Chancellor’s Animal Research Committee at University of California Los Angeles.
Surgery. Rats, weighing between 300 and 450 gm, were anesthetized with a mixture of xylazine and ketamine (ketamine dose: 86 mg/kg, i.p.; xylazine dose: 12 mg/kg, i.p.). Each rat was implanted with two chronic stimulating electrodes ipsilaterally in the medial forebrain bundle. Each lateral hypothalamic electrode was a stainless steel insect pin insulated to within 0.5 mm of its exposed tip (LH stereotaxic coordinates: 2.2 mm posterior to Bregma, 1.8 mm lateral to midline, 8.6–8.7 mm below the horizontal skull surface).
In the [14C]deoxyglucose experiment, ventral tegmental electrodes were also insulated stainless steel insect pins (VTA stereotaxic coordinates: 4.9 mm posterior to Bregma, 0.9 mm lateral to midline, 8.6–8.7 mm below the horizontal skull surface). In the True Blue experiment, each VTA electrode consisted of an externally insulated 22 gauge stainless steel guide cannula from Plastics One. A stainless steel dummy cannula of the same length as the VTA guide cannula was inserted into the guide, and the exposed circular surface formed by the guide and dummy cannulae served as the stimulating tip of the VTA electrode.
Apparatus. All self-stimulation sessions took place in Plexiglas Skinner boxes measuring 25 cm wide × 25 cm long × 34 cm high. A single retractable rodent lever was centered 4 cm off the floor, along one wall. A connector cord set from Plastics One connected a rat’s implanted electrode to an electrical stimulator. A microcomputer system controlled the stimulator, determined the timing of lever retraction and extension, and recorded all data. Depression of the lever delivered a 0.5 sec train of 0.1 msec constant current cathodal pulses from the electrical stimulator through the electrode to the rat’s brain. Between pulses, a low-resistance shunt between the stimulating and indifferent electrodes prevented electrode polarization.
Experimental design and groups. One week after surgery, all rats were placed in a Skinner box and screened for the rewarding efficacy of stimulation at both the VTA and LH electrodes. Subsequent experimental groupings depended on the following rationale. Rewarding stimulation was to be delivered to the VTA; therefore, all animals in the stimulated groups lever-pressed for stimulation through the VTA electrode. To maximize the likelihood that reward fibers would be disrupted by the lesions, animals were assigned to the stimulated–lesioned group only if they lever-pressed for stimulation via the LH electrode as well.
In the True Blue experiment, rats with and without LH lesions were compared. Rats that would respond for stimulation only via the VTA electrode were assigned to the stimulated–intact group. Rats that learned to lever press on both the VTA and LH electrodes were assigned to the stimulated–lesioned group.
In the [14C]DG experiment, a 2 × 2 design was used, with rats assigned to groups as follows.
Stimulated–intact: The eight rats in this group responded to stimulation via the VTA electrode, but not via the LH electrode (DG11, 12, 14, 20, 40, 43, 58, 59).
Stimulated–lesioned: The nine rats in this group responded to stimulation via both the VTA and LH electrodes (DG9, 15, 16, 22, 34, 39, 41, 51, 56).
Unstimulated–intact: The four rats in this group had no response via either electrode (DG24, 37, 42, 49).
Unstimulated–lesioned: The six rats in this group had no response via either electrode (DG18, 44, 45) or responded only to stimulation via the LH electrode (DG28, 44, 45).
Behavioral data collection and analysis. Behavioral training and testing procedures were essentially identical in the True Blue and [14C]deoxyglucose experiments. Rats in the stimulated groups were first trained to press the lever and to expect a series of lever retractions and extensions. Then, the trade-off function between threshold pulse frequency and current was determined at the VTA electrode for each animal. Frequency–current trade-off sessions were run regularly over a 2–6 week period. After a warm-up and extinction trial, each session consisted of a number of multi-trial sweeps. Within each sweep, the current (microamperes) delivered when the animal pressed the lever remained constant, whereas the pulse frequency (pps) varied; across sweeps, the animal was exposed to a range of currents (from the lowest sustaining lever pressing for that animal to 1000 μA). Each sweep contained 10 30 sec trials, across which the pulse frequency in the train varied randomly, spanning a 1.0 log10 unit range in 0.1 log10 unit steps. The range of pulse frequencies was chosen so that approximately half would sustain rapid lever pressing and half would not. The microcomputer recorded the number of times the animal pressed the lever during each 30 sec trial.
A three-parameter Weibull function [Rate = a*(1 − 2** − ((log10 (pps/t)**s))] was fit to the rate-frequency data from each current sweep using the least squares nonlinear regression routine in the RS/1 graphing and statistics package from Bolt, Beranek, and Newman. From this function, the threshold pulse frequency (t), defined as the pulse frequency required to sustain half-maximal rates of lever pressing, was determined for every current tested in a given session. The complete trade-off function was then graphed as the plot of threshold pps versus current on log–log coordinates.
Previous lesion experiments have shown larger threshold shifts at lower stimulating currents (Murray and Shizgal, 1996b). As the current is lowered, the radius of excitation decreases, and only fibers very close to the electrode tip are activated. In some cases, lesion effects have been observed only at the minimum current below which the subject would not self-stimulate at any pulse frequency (the “current wall”) (Gallistel et al., 1996). Determining the current wall requires varying pulse frequency in the high-frequency range and determining the threshold current (Shizgal et al., 1979). Therefore, additional sessions were run to determine the current wall. In these sessions, the pulse frequency varied between sweeps, and current varied across trials within sweeps (spanning a 0.5 log10 unit range in 0.05 log10 unit steps).
On the day of the lesion or sham treatment, rats from the stimulated groups ran a final frequency–current trade-off session. After a rest period of 30–60 min, rats in the lesioned groups received an electrolytic lesion via the LH electrode while they were unanesthetized (300 μA constant cathodal current for 200 sec). Rats in the intact groups received no lesioning stimulation. Within 1 hr after either their lesion or sham treatment, all rats were run through an initial post-treatment frequency–current session. If necessary, the ranges of current and/or pulse frequency were increased to sustain lever pressing. Post-treatment frequency–current sessions were then run regularly during the next 3–7 weeks. The log frequency versus log current trade-off functions were determined for each session, using the procedure described above. Post-treatment current wall sessions were also run approximately weekly.
Unpaired two-tailed t tests were used to compare both the mean threshold frequencies from pretreatment and post-treatment sessions and the geometric means of the current wall data from pretreatment and post-treatment sessions. Comparisons of threshold frequencies were performed at 200, 400, and 800 μA.
During training, rats in the unstimulated groups of the [14C]DG experiment were placed in Skinner boxes for 30–60 min on multiple occasions to acclimate them to that environment. On the day of either the lesion or sham treatment, each rat was placed in a Skinner box without stimulation for 30–60 min. Rats in the unstimulated–lesioned group then received lateral hypothalamic electrolytic lesions (parameters, as above). Animals in both unstimulated groups were left in the box for an additional 20–60 min and placed in the Skinner boxes on multiple occasions thereafter.
True Blue implantation and tissue processing. To visualize the cell bodies of fibers coursing through the site of VTA stimulation, we chose True Blue, a retrograde tracer taken up by fibers of passage (Swanson, 1983). To maximize the overlap of stimulated and labeled projections, we applied the True Blue directly at the site of stimulation. At the conclusion of behavioral testing, True Blue crystals (true blue, chloride salt from Molecular Probes, Eugene, OR) were applied to the end of a 28 gauge internal cannula from Plastics One. The internal cannula (with the dye) was then inserted into the previously implanted VTA guide cannula and secured with a crystal applicator cover from Plastics One. After this procedure, animals were left for 16–21 d to allow time for uptake and retrograde transport of the dye (Sawchenko and Swanson, 1981; Swanson, 1983).
After the period of dye transport, animals were killed by an overdose of intraperitoneal sodium pentobarbital and transcardiac perfusion with 150 ml of 0.9% saline followed by 500 ml of 10% formalin (10°C, pH 7.4). Each brain was removed and placed in 10% formalin/15% sucrose post-fixative and cryoprotective mixture overnight at 20°C. Coronal sections (35 μm) were then cut on a cryostat at −15°C. A series of adjacent sections was collected at least every 350 μm from the frontal poles through the medulla. Extra sections were collected through the LH electrode tracks, the VTA cannula tracks, and the lesions. Adjacent sections were collected for thionin histology and True Blue fluorescence. All sections were placed directly onto pig-gelled slides, allowed to dry overnight, stained, and coverslipped. The histological sections were stained with thionin, dehydrated through an alcohol series, and coverslipped with Permount. True Blue sections were coverslipped with a buffered glycerol mountant.
Deoxyglucose sessions and tissue processing. To visualize the synaptic activity generated by VTA stimulation, we used [14C]DG autoradiography. [14C]DG has been well established as a specific marker of regional metabolic activity in brain stimulation reward experiments (Yadin et al., 1983; Esposito et al., 1984; Porrino et al., 1984, 1990; Gallistel et al., 1985). Increases in [14C]DG accumulation reflect increases in activity primarily at the synaptic terminals of neurons stimulated directly or trans-synaptically (Kennedy et al., 1975; Sharp et al., 1993; Sokoloff, 1993).
At the end of all behavioral testing, each rat in the [14C]deoxyglucose experiment ran a final session. Before this session, each was injected subcutaneously with either 50 μCi of [14C]2-deoxyglucose (2DG) or 25 μCi of [14C]2-fluoro-2-deoxyglucose (FDG) in 0.5 ml saline. [Once experimental protocols were established with the less expensive [14C]2DG, [14C]FDG was used preferentially. Because of its more rapid accumulation and lower background, less [14C]FDG produces higher quality autoradiographic images (Miller and Kiney, 1981)]. Animals in the stimulated groups then lever-pressed for a constant level of stimulation during a 1–2 hr session. The current delivered was either 400 μA or, in animals who would not work for that current, 1000 μA. The pulse frequency was set at 0.5 log10 units (three times) above a given animal’s post-treatment threshold pulse frequency at 400 μA or 1000 μA. This level of stimulation should have produced a nearly maximal level of reward (Simmons and Gallistel, 1994). It was chosen to ensure that each animal pressed regularly during the DG session. Unstimulated animals were placed in the Skinner box without stimulation for 1–2 hr.
At the conclusion of the deoxyglucose session, animals were given an overdose of sodium pentobarbital, and their brains were removed. The removed brain tissue was immediately frozen on either crushed dry ice directly or in isopentane cooled with dry ice. Brains were stored at −70°C until sectioning. Coronal sections 20–25 μm thick were collected in a cryostat at −13 to −15°C. Adjacent sections were collected for [14C]DG autoradiography and thionin staining. Sections were collected across the entire rostrocaudal extent of the brain, with a series being taken at least every 300 μm, from the frontal pole through the medulla. All sections were collected onto pig-gelled microscope slides.
Slides with sections for 14C autoradiography were immediately dried on a hot plate and then exposed to film in light-tight boxes for 14–38 d. These same sections were subsequently processed for cytochrome oxidase histochemistry as follows. Sections on slides were exposed to a solution of 0.5 mg/ml diaminobenzidine and 0.9 mg/ml cytochrome c (type III; Sigma, St. Louis, MO) in buffered saline for 45–90 min. These slides were then washed in buffered saline, dehydrated through an alcohol series, and coverslipped. Adjacent sections were stained with thionin, dehydrated through an alcohol series, and coverslipped.
Histological analyses. For both experiments, electrode, cannula, and lesion locations as observed under low-power microscopy were mapped onto plates of the Swanson atlas (Swanson, 1992). To assess the extent to which electrode placements were comparable in the intact and lesioned groups, electrode tip locations were quantified using the coordinate system from the Swanson atlas for the anterior–posterior (A-P), medial–lateral (M-L), and dorsal–ventral (D-V) dimensions (Swanson, 1992). For each experiment, two-tailed Kolmogorov–Smirnov tests were used to compare the distributions of the anterior–posterior VTA electrode placements between the stimulated–intact and stimulated–lesioned groups. For each experiment, unpaired two-tailedt tests were run to compare the dorsal–ventral and medial–lateral VTA electrode placements between the stimulated–intact and stimulated–lesioned animals.
To describe the LH lesions and to assess their variability across animals, lesion sizes and locations were quantified. The size of each lesion was determined using the maximal cross-sectional area. Unpaired two-tailed t tests were run to compare lesion size between the unstimulated–lesioned and stimulated–lesioned groups in the [14C]DG experiment as well as between the stimulated–lesioned groups in the True Blue and [14C]DG experiments. The location of each lesion was defined by the Swanson plates corresponding to the lesion’s rostral margin, caudal margin, and maximum cross-sectional area. Two-tailed Kolmogorov–Smirnov tests were used to compare these measures between animals in the stimulated–lesioned versus unstimulated–lesioned groups in the [14C]DG experiment. In addition, the extent to which each lesion damaged several specific MFB projections was estimated from comparisons of each lesion’s location, as mapped onto plates of the Swanson atlas, to the published topographical organization of the MFB (Veening et al., 1982). The extent to which damage to a particular MFB projection predicted regional patterns of True Blue labeling, regional [14C]DG accumulation, and shifts in threshold pulse frequency was analyzed using a series of one-tailed Spearman rank order correlations.
Localization of True Blue. Comparisons of True Blue labeling patterns were used to assess the extent to which LH lesions structurally disconnected the VTA from cell bodies in the forebrain. True Blue labeling was observed in the cytoplasm of neuronal somata using incident UV fluorescence microscopy. Dark-field microscopy was used with the same sections to identify particular regions and nuclei within which the True Blue-containing cells were found. Although these areas were defined with reference to neuroanatomical atlases of the rat brain, precise structural and/or functional boundaries are always difficult to determine (Kruger et al., 1995). For this study, regions were defined to make possible statistical analyses comparing results from the different experimental groups and to identify areas worth focusing on in future work of this kind. Thus, although regions of interest will be referred to by anatomical designations from the Swanson atlas, these names indicate only approximate locations rather than precise structural or functional entities (Swanson, 1992).
The amount of tissue covered by the True Blue dye in three dimensions around the cannula tip was measured with a reticule under fluorescent microscopy. Two-tailed, unpaired t tests were run to compare each of the three dye-spread measurements between the stimulated–intact and stimulated–lesioned groups.
Labeled cells in each animal were mapped onto plates of the Swanson atlas within Adobe Illustrator using patterns that designated approximate cell densities (Swanson, 1992). Six density categories were used: no cells, occasional cells, scattered, moderate, dense, and very dense. The proportion of each region covered by cells (of any density greater than scattered) was also scored for each animal. Percent-coverage categories were 10, 25, 50, 75, 90, or 100%. After cell mapping was completed, the Swanson plates from each brain were examined for regions ipsilateral to the site of dye implantation, which consistently contained dye-filled cells in stimulated–intact animals. Ninety such regions throughout the neuraxis were identified. The density and coverage of cells in each of these regions was recorded for each animal in both the stimulated–intact and stimulated–lesioned groups. To determine the extent to which dye was taken up and transported in each animal, the frequency of cell densities across all regions was calculated, and frequency histograms were generated. If >65% of these regions contained no cells in a given animal, the assumption was made that adequate dye uptake had not occurred; that subject was then excluded from all analyses.
To compare regional cell labeling between the stimulated–intact and stimulated–lesioned groups, the frequency of the peak cell density within each forebrain region was scored for all of the animals in each group. The number of times a given region fell into a given percent-coverage category within each group was also determined. Two-tailed Kolmogorov–Smirnov tests were used to compare these distributions for all forebrain regions and for each region of interest individually.
Autoradiographic analysis. To assess the extent to which LH lesions functionally disconnected synapses within basal forebrain nuclei from the VTA, the patterns of [14C]deoxyglucose accumulation were compared. [14C]deoxyglucose autoradiographs were analyzed using two Macintosh-based software programs: Adobe Photoshop, version 2.5.1, and Drexel’s Brain, version 1.4. Film with autoradiographic images and slides with histological sections were placed on an evenly lit light box, and section images were scanned into Drexel’s Brain using a CCD video camera. The video calibration option of Drexel’s Brain was used before scanning to correct for the dark signal of the camera. Representative autoradiographic images across the rostrocaudal extent of the brain were scanned into the computer, as were the adjacent thionin and/or identical cytochrome oxidase histological section images.
The range of current spread at the tip of each stimulating electrode was estimated from the area of very dense pixels visible around the tips on the autoradiographs. On scanned autoradiographs within Adobe Photoshop, the width, height, and area of the region containing very dense pixels was measured. Unpaired, two-tailed t tests were used to compare the width, height, and area of current spread between those stimulated–intact and stimulated–lesioned animals that ran DG sessions at 400 μA.
Autoradiographic images were then inspected for obvious areas of increased optical density ipsilateral to the electrodes. In Adobe Photoshop, the images were contrast-enhanced to bring out areas of high optical density. In this way, the approximate locations of areas activated by the stimulation were determined, and six coronal planes of section and multiple regions of interest within each plane were chosen for the final analyses. The borders of the regions of interest were defined by consistent histological landmarks, and a set of drawing rules was established based on these borders [as in Gallistel et al. (1985)]. Each region of interest was outlined bilaterally on the appropriate histological section image. Because the histological image was either identical or adjacent (within 20 μm) to the autoradiographic image, the regional outlines could be transferred onto the autoradiographic image by simply aligning the two images within Drexel’s Brain and copying the outlines.
Regional accumulation of [14C]deoxyglucose was determined using the relative optical density (ROD) of the pixels within an outlined area on the autoradiographic image. The ROD expresses the density of an individual pixel relative to the density of pixels across an entire section. Specifically, the ROD of a given pixel is the proportion of the total pixels in the entire image that have a density less than the density of that pixel. The ROD is not a ratio, then, but a percentile ranking. Because rank is invariant under monotone transformations, the ROD is not altered by any factor that has a monotonic effect on optical density, such as differences in exposure time or the curvilinear relationship between optical density and [14C]DG tissue concentration (Kelly and McCulloch, 1983; Gallistel et al., 1985). The ROD has been shown to be a sensitive and robust method for detecting localized differences in functional activity (Gallistel et al., 1985).
The ipsilateral effects of VTA stimulation and LH lesions were determined by calculating the interhemispheric differences between the mean RODs within a given region. For this analysis, the mean ROD of a given region contralateral to the electrodes was subtracted from the mean ROD of that same region ipsilateral to the electrodes. This subtraction eliminated the between-animal, within-group variance, thus increasing the power of the statistical testing. A two-way ANOVA was run on the data from each region to examine the main effect of stimulation, the main effect of lesion, and the stimulation-by-lesion interaction. It was expected that VTA stimulation would increase activity ipsilateral to the electrode in many regions in stimulated–intact animals, whereas LH lesions would diminish ipsilateral activity throughout the brain. Central to this experiment was the interaction between the stimulation and the lesion. If a region were entirely disconnected from the stimulation site by the LH lesion, then VTA stimulation should increase 14C accumulation in that region in intact animals, but not in animals with lesions. All significant interactions were followed by post hoc testing using t tests.
Correlations between connectivity and behavior. The extent to which each measure of midbrain–forebrain connectivity predicted the behavioral impact of a given LH lesion was analyzed using a series of correlations. One-tailed Spearman rank order correlations were used to compare True Blue cell density and coverage to postlesion shifts in threshold pps. To correlate regional [14C]DG accumulation and threshold pps, parametric correlation coefficients were calculated.
RESULTS
Behavioral results
Stimulated–intact animals
Across the True Blue and [14C]deoxyglucose experiments, 17 rats lever-pressed for rewarding stimulation at electrodes in the VTA without receiving lateral hypothalamic lesions. No increases in threshold pulse frequency were observed in 16 of these animals after the sham treatment (Table1). Figure1 shows the threshold pps measure over time in six of the stimulated–intact animals.
Shifts in threshold pulse frequency and current wall in stimulated-intact animals

Behavioral data from six representative stimulated–intact animals. Threshold pulse frequencies (pps on log10 scale) are shown at 200 μA (○), 400 μA (shaded triangles), and 800 μA (▪). Pre-sham points represent geometric means of multiple sessions (SEs of fit smaller than symbols). Post-sham data points were established in individual sessions run approximately daily. Linesthrough the post-sham points represent the geometric means of the threshold pps at each current across all post-sham sessions. In the True Blue (TB) experiment, the stimulating electrode was a 22 gauge cannula, and threshold pps were measured at 400 and 800 μA. With the smaller insect pin electrode in the [14C]DG experiment, animals received a greater flux at the electrode tip and worked at lower stimulating currents; thresholds in the [14C]DG experiment were therefore determined at 200 μA as well. Significant elevations in threshold pps (i.e., reductions in rewarding efficacy) were observed in only 1 of the 17 stimulated–intact animals tested in the True Blue and [14C]deoxyglucose experiments (DG59).
In 12 of the stimulated–intact animals, the threshold pulse frequencies drifted downward over time (TB37, 45, 53, 56, 59, 63, 64; DG14, 20, 40, 43, 58). However, in no case did the threshold change abruptly at the time of the sham treatment (Fig.2). In one stimulated–intact animal, post-sham thresholds drifted upward by 0.13 to 0.17 log10units after the sham date; again, in sessions immediately after the sham date, thresholds changed by <0.1 log10 unit (DG59). Four of the stimulated–intact rats showed no statistically significant change in threshold pps at any current after the sham treatment (TB31 and 61; DG11 and 12). The current wall also decreased over time in many stimulated–intact animals, usually by <0.1 log10 unit (Table 1). Thus, unlesioned rats generally tended to become slightly more responsive to the stimulation over time.

Threshold pulse frequencies (pps on log10 scale) for the three sessions before and immediately after the date of sham treatment (session 0) from seven representative stimulated–intact animals. These animals did not show abrupt changes in threshold pps after the sham date.
Stimulated–lesioned animals
Across the two experiments, 17 rats self-stimulated at VTA electrodes and received electrolytic lesions in the MFB at the level of the LH (Table 2). Figures3 and 4show that postlesion threshold shifts in these animals ranged from none or little to large and unequivocal.
Shifts in threshold pulse frequency and current wall in stimulated-lesioned animals

Behavioral data from six of the eight stimulated–lesioned animals in the True Blue (TB) experiment. Postlesion shifts in threshold pulse frequency (pps on log10 scale) ranged from −0.22 to 0.51 log10units. Threshold pps shown at 400 μA (shaded triangles) and 800 μA (▪). Prelesion points represent geometric means of multiple sessions (SEs of fit smaller than symbols).Lines through the postlesion points represent the geometric means of the threshold pps at each current across all postlesion sessions.

Behavioral data from six of the nine stimulated–lesioned animals in the [14C]deoxyglucose (DG) experiment. Postlesion shifts in threshold pulse frequency (pps on log10 scale) ranged from −0.39 to 0.54 log10units. Threshold pps shown at 200 μA (○), 400 μA (shaded triangles), and 800 μA (▪). Prelesion points represent geometric means of multiple sessions (most SEs of fit smaller than symbols). Lines through the postlesion points represent the geometric means of the threshold pps at each current across all postlesion sessions.
Eight subjects showed no enduring increase in the VTA self-stimulation threshold in response to the LH lesion. Three animals in the stimulated–lesioned groups lever-pressed for brain stimulation reward within 1 hr of lesioning, and subsequently showed no significant increases in threshold pulse frequency at any current (TB38; DG22 and 39). TB41 exhibited some motor impairment immediately after its lesion and did not groom well for 3–4 d. By the sixth postlesion day, TB41 was able to work for prelesion levels of stimulation. Four other animals had statistically significant decreases in threshold pps at one or more currents after the lesion (TB47 and TB57; DG41 and DG51).
In three of the stimulated–lesioned animals, threshold pulse frequencies increased by small but statistically significant amounts (TB54; DG15 and 34). TB54 exhibited disruption of its motor abilities, including counterclockwise circling that prevented adequate testing, until the fourth postlesion day. After these motor deficits resolved, TB54’s threshold pps remained 0.08 log10 units above the prelesion means at both 400 and 800 μA (Table 2). DG15’s motor function was also impaired by the lesion; this animal would not work for 5 d after the lesion and was not tested during the following 2 weeks. When tested on postlesion day 21, its threshold pps at 400 μA had increased by 0.08 log10 units, whereas its threshold pps at 800 μA remained at the prelesion level (Table 2). DG34 also had some motor difficulties after the lesion and required 2–3 d to regain its normal lever-pressing abilities. This rat’s threshold pps increased by 0.09 log10 units at 200 μA and by 0.05 log10 units at 400 μA (Table 2). The current walls of TB54 and DG15 increased by >0.2 log10 units after the lesions, suggesting that their lesions eliminated reward fibers passing very close to the stimulating electrode tip.
In the remaining six stimulated–lesioned rats, threshold pulse frequencies increased substantially within 3 d of their lesions (TB43, 46, 51; DG9, 16, 56). TB43’s thresholds shifted up by 0.20 log10 units at 400 μA and by 0.23 log10 units at 800 μA. These shifts correspond to a 1.6- and 1.7-fold change in rewarding efficacy, respectively. In TB46, the threshold pps measured at 400 μA continued to increase over time. Averaged over the entire postlesion period, the lesion caused a 3.2- and 2.5-fold increase in threshold pps at 400 μA and 800 μA, respectively. TB51’s 0.36 and 0.26 log10 unit shifts in threshold pps indicate a 2.3-fold (400 μA) and 1.8-fold (800 μA) reduction in rewarding efficacy. In DG9, the threshold pps at each of the currents increased by 0.53–0.54 log10 units, a 3.4-fold change. DG16 worked only at currents above 500 μA after the lesion; at 800 μA, DG16’s threshold increased by a factor of 4.8 (0.68 log10 units). DG56’s threshold pps shifted 0.34 log10 units at 400 μA and 0.29 log10 units at 800 μA, a 2.2- and 1.9-fold increase, respectively. Five of these six rats also had large increases in their current walls (TB46 and 51; DG9, 16, 56) (Table 2). These threshold shifts are among the largest ever observed with lesions rostral to a stimulating electrode (cf. Arvanitogiannis et al., 1996b;Murray and Shizgal, 1996b).
Histological results
The VTA cannulae and electrodes, LH electrodes, and LH lesions from representative animals in the True Blue and [14C]deoxyglucose experiments are illustrated in Figures 5 and6.

Histology of representative animals from the True Blue (TB) experiment. Left column, Stimulated–intact animals; middle column, stimulated–lesioned animals with small postlesion changes in threshold pulse frequency; right column, stimulated–lesioned animals with large postlesion threshold elevations. Electrodes, cannulae, and lesions are shown on coronal plates from the Swanson atlas (Swanson, 1992). Rostrocaudal coordinates are given in millimeters behind Bregma, according to the stereotaxic system presented in Paxinos and Watson (1986) and Swanson (1992). Thetop panel for each animal represents the level of the LH electrode in stimulated–intact animals and the LH lesion at its maximum cross-sectional area in stimulated–lesioned animals. Thebottom panels show the locations of the ventral tegmental cannulae through which both electrical stimulation and True Blue dye crystals were delivered.

Histology of representative animals from the [14C]deoxyglucose (DG) experiment.Left column, Stimulated–intact animals; middle column, stimulated–lesioned animals with small postlesion changes in threshold pulse frequency; right column, stimulated–lesioned animals with large postlesion threshold elevations. Electrodes and lesions are shown on coronal plates from the Swanson atlas (Swanson, 1992). Rostrocaudal coordinates are given in millimeters behind Bregma, according to the stereotaxic system presented in Paxinos and Watson (1986) and Swanson (1992). Thetop panel for each animal represents the level of the LH electrode in stimulated–intact animals and the LH lesion at its maximum cross-sectional area in stimulated–lesioned animals. Thebottom panels show the locations of the ventral tegmental stimulating electrodes.
VTA Cannulae (Fig. 5)
Stimulation cannulae placements in the True Blue experiment did not differ significantly between the two groups of animals. In both the stimulated–intact and stimulated–lesioned groups, the cannulae ranged in the A-P plane from 4.20 to 5.00 mm caudal to Bregma. The Kolmogorov–Smirnov test showed these two distributions to be statistically indistinguishable. The D-V tip locations averaged 1.20 ± 0.20 mm (mean distance from base of brain ±SD) in the stimulated–intact group and 1.22 ± 0.15 mm in the stimulated–lesioned animals. An unpaired, two-tailed t test revealed no significant difference between the D-V coordinates in these groups, nor did the M-L tip locations differ significantly between the stimulated–intact and stimulated–lesioned groups (unpaired, two-tailed t test; stimulated–intact, 0.57 ± 0.13 mm from midline; stimulated–lesioned, 0.56 ± 0.14).
Patterns of retrograde labeling with True Blue could have varied with the site of initial dye implantation and uptake. The diameter of True Blue dye spread around the site of implantation measured ∼1 mm in the D-V, M-L, and A-P dimensions in all animals. There were no significant differences between the stimulated–intact and stimulated–lesioned groups in the volume of tissue covered by dye in any dimension [D-V by M-L by A-P (mean ± SD); stimulated–intact group: 0.94 ± 0.21 by 1.07 ± 0.15 by 1.27 ± 0.37 mm; stimulated–lesioned group: 0.93 ± 0.21 by 1.14 ± 0.23 by 1.15 ± 0.27 mm]. Inspection of the dye implantation sites revealed that overlapping structures were covered by the True Blue crystal in all animals; these areas included the ventral tegmental area itself, the mammillary nuclei, the posterior hypothalamic nucleus, the caudal lateral hypothalamic nucleus, the mammillary peduncle, and the principal mammillary tract.
VTA electrodes (Fig. 6)
The placements of the VTA electrodes did not differ significantly between the two groups of stimulated animals in the [14C] DG experiment. The A-P electrode locations ranged from 4.20 to 6.50 mm posterior to Bregma in the stimulated–intact group and from 4.20 to 5.65 mm in the stimulated–lesioned group. These distributions of A-P locations did not differ significantly between the two groups (Kolmogorov–Smirnov test). The D-V tip locations averaged 1.76 ± 0.14 mm (mean ± SD) above the base of the brain in the stimulated–intact group and 1.82 ± 0.22 mm in the stimulated–lesioned animals. An unpaired, two-tailed t test revealed no significant differences between these D-V coordinates. The M-L tip locations also did not differ significantly between the groups (unpaired, two-tailedt test; stimulated–intact: 0.84 ± 0.25 mm; stimulated–lesioned: 0.82 ± 0.29).
Patterns of activation across the brain could have been affected by the local spread of current around the electrode tip. The area of very dense pixels surrounding each VTA electrode tip was therefore examined in 14 of the 17 stimulated animals (those tested at 400 μA). There were no significant differences in the maximum cross-sectional width, height, or area of this variable between the stimulated–intact and stimulated–lesioned animals (two-tailed, unpaired ttests).
Because small movements of an electrode tip within an animal can cause large changes in brain stimulation reward thresholds, electrode tips were fixed in these experiments, and animals served as their own behavioral controls (Gratton and Wise, 1983; Miliaressis and Philippe, 1983; Forgie and Shizgal, 1993). The quantitative measures presented here serve primarily to demonstrate that there were no systematic differences in the sites of VTA stimulation or dye implantation between stimulated–intact and stimulated–lesioned animals, allowing between-group comparisons of the True Blue labeling and [14C]DG accumulation patterns.
LH lesions
As in virtually all lesion studies, the LH lesions in these experiments varied from animal to animal in their precise placement and extent. However, across animals, the lesions encompassed overlapping regions (Figs. 5, 6). The ranges of lesion size and location in these experiments were comparable to those in previous studies (Stellar and Neely, 1982; Waraczynski, 1988; Murray and Shizgal, 1991, 1996b;Gallistel et al., 1996).
Lesion size
At their maximal cross-sectional area, lesions ranged in size from 0.26 to 1.87 mm2 in the True Blue experiment. In the [14C]DG experiment, lesions ranged from 0.35 to 2.63 mm2 in the stimulated–lesioned group and from 0.43 to 2.63 mm2 in the unstimulated–lesioned group. There was no significant difference in lesion size between the stimulated–lesioned groups in the True Blue and [14C]DG experiments or between the two lesioned groups in the [14C]DG experiment (unpaired, two-tailed t tests).
Lesion location
In the True Blue experiment, the A-P location of the lesions at their maximum cross-sectional area ranged from 0.83 to 2.45 mm posterior to Bregma (Figs. 5, 6). The most rostral regions reached by the lesions ranged from 0.51 to 1.78 mm posterior to Bregma, and the caudal borders of the lesions ranged from 1.53 to 3.90 mm. In the [14C]DG experiment, maximal lesions were located from 1.08 to 2.85 mm posterior to Bregma in the stimulated–lesioned group and from 0.83 to 2.45 mm in the unstimulated–lesioned group. The rostral margins of the LH lesions ranged from 0.26 to 2.45 mm posterior to Bregma in the stimulated–lesioned animals and from 0.26 to 1.78 mm in the unstimulated–lesioned group. The caudal margins of the LH lesions ranged from 1.53 to 4.45 mm posterior to Bregma in the stimulated–lesioned animals and from 1.53 to 3.25 mm in the unstimulated–lesioned group. There were no statistically significant differences in the frequency distributions of any of these parameters between the stimulated and unstimulated groups (Kolmogorov–Smirnov tests).
In both experiments, lesions were located within the defined boundaries of the MFB proper: mediolaterally between the fornix and the internal capsule/cerebral peduncle and dorsoventrally between the zona incerta and the base of the brain (Nieuwenhuys et al., 1982; Veening et al., 1982). Lesions tended to damage fibers coursing through the dorsolateral compartments of the MFB, whereas they spared the most medial MFB projections (Veening et al., 1982). The LH lesions appeared to cause the most damage to projections descending from the nucleus accumbens, because these fibers travel in the dorsolateral MFB in a well circumscribed bundle (compartment e). The lesions also appeared to damage a substantial proportion of the ventrolateral MFB compartment containing fibers from the magnocellular preoptic nucleus (compartment a). In addition, the dorsomedial compartments (c and g) containing fibers from the bed nucleus of the stria terminalis frequently sustained significant damage. Although located within the ventromedial part of the MFB, efferent fibers from the nucleus of the diagonal band (NDB) course in a small, tight bundle. Therefore, those LH lesions that extended ventromedially should have eliminated many of the NDB fibers. On the other hand, the projection from the lateral septal nucleus primarily runs through the hypothalamus medial to the MFB proper, and the lateral preoptic projection consists of a large number of fibers distributed diffusely within and medial to the MFB. Accordingly, most of the lateral septal and lateral preoptic fibers appeared to be spared by the lesions in these experiments. Although not pictured in the Veening atlas, the MFB projection from the substantia innominata (SI) includes fibers from the dorsal SI running in the dorsolateral MFB and fibers from the ventral SI in the ventromedial SI (Grove, 1988). The lesions in this experiment should have eliminated the former fibers, but should have spared many of the latter. Finally, the mesolimbic projection from the VTA courses centrally within the MFB. These fibers appear to have been completely transected by all but one of the LH lesions.
True Blue labeling patterns
In stimulated–intact animals, True Blue dye implanted through the VTA electrode labeled cell bodies throughout the neuraxis. Rostral areas with moderate-to-dense labeling included the infralimbic area, the nucleus accumbens, the fundus of the striatum (FS), the nucleus of the diagonal band, the bed nucleus of the stria terminalis, the substantia innominata, and the preoptic areas. All of these areas contain cell bodies with known afferents to the ventral tegmental area, all project axons through the medial forebrain bundle, and all could contain the cell bodies of neurons critical to brain stimulation reward (Phillipson, 1979; Swanson and Cowan, 1979; Nieuwenhuys et al., 1982;Swanson, 1982; Oades and Halliday, 1987).
We hypothesized that the LH lesions would transect MFB projections from the forebrain, thereby preventing retrograde transport of True Blue from fibers of passage at the site of dye implantation to cell bodies in nuclei rostral to the lesion. Therefore, we expected significant decreases in both cell density and cell coverage within the forebrain regions of the stimulated–lesioned animals. To test our hypothesis grossly, the degree of labeling across all of the forebrain regions of interest was compared between the animals with and without LH lesions. As expected, the overall distribution of cell densities and the overall distribution of cell coverage differed significantly between the stimulated–lesioned and the stimulated–intact groups (Fig.7) (density: Kolmogorov–SmirnovD160,144 = 0.233, p < 0.001; coverage: D112,69 = 0.197, p < 0.001). Subsequent region-by-region analyses demonstrated that these overall differences arose, not from a generalized loss of labeling across the forebrain, but rather from the selective disconnection of specific forebrain nuclei from the site of stimulation and dye implantation.

True Blue cell labeling across all forebrain areas in the stimulated–intact (black bars) and stimulated–lesioned (gray bars) groups. Forebrain regions included in this analysis were the infralimbic area, caudate-putamen, claustrum, cingulate cortex, substantia innominata, fundus of the striatum, lateral septum, nucleus of the diagonal band, bed nucleus of the stria terminalis, and the preoptic areas.Left, Distributions of cell densities.Right, Distributions of cell coverage (percentage of area covered for all densities > scattered). Stimulated–intact animals had significantly greater True Blue labeling in the forebrain than stimulated–lesioned animals (two-tailed Kolmogorov–Smirnov tests; density: D160,144 = 0.233,p < 0.001; coverage:D112,69 = 0.197, p < 0.001). no, No; occ, occasional;scat, scattered; mod, moderate.
Many forebrain areas remained structurally connected to the VTA even after the LH lesions. Cells labeled with True Blue were commonly seen in the infralimbic and anterior cingulate cortical areas in both the stimulated–intact and stimulated– lesioned animals. Neither the distributions of cell densities nor the percent coverage in these regions differed significantly between the groups. Neurons were also filled with True Blue in the NDB and in the intermediate part of the lateral septal area (LSi) in both stimulated–intact and stimulated–lesioned animals (Fig. 8). The distributions of cell densities in these regions did not differ significantly between the groups. In the LSi, however, cell coverage did tend to be less in the stimulated–lesioned group than in the stimulated–intact group (Kolmogorov–SmirnovD5,6 = 0.633, p < 0.01). Finally, cell density and coverage distributions spanned statistically equivalent ranges in both the MPO and LPO (Fig. 8).

Distributions of cell density and coverage in several forebrain areas without significant reductions in True Blue labeling after lateral hypothalamic lesions. Stimulated–intact (black bars) versus stimulated–lesioned (gray bars). NDB, Nucleus of the diagonal band; LSi, lateral septal nucleus, intermediate part; LPO, lateral preoptic area. Comparisons of these distributions showed no statistical difference except in cell coverage of the LSi (two-tailed Kolmogorov– Smirnov test; intact > lesioned,D5,6 = 0.633, p < 0.01). Abbreviations defined in legend to Figure 7.
Significant decreases in cell labeling rostral to the lateral hypothalamic lesion were observed in five regions: the nucleus accumbens (Acc), the FS, the bed nucleus of the stria terminalis (BST), the SI, and the magnocellular preoptic nucleus (Fig.9). In the Acc, there was a marked lesion effect. Moderate to dense labeling covering 50–100% of the Acc was observed in the majority of stimulated–intact animals. In seven of the eight stimulated–lesioned animals, however, no labeled cells were seen in the accumbens; only 25% of the region was covered with cells in the remaining stimulated–lesioned animal. The Kolmogorov– Smirnov statistic for the difference between the two density histograms was significant at the p < 0.01 level (density: D8,9 = 0.778; p< 0.01). In the FS, cell densities fell in the moderate to dense categories in five of the nine stimulated–intact cases; in the stimulated–lesioned group, most of the animals had no cells in the FS (density: D8,9 = 0.667, p < 0.01). Significantly more cells were also found in the bed nucleus of the stria terminalis in the stimulated–intact group (density:D8,9 = 0.556, p < 0.01; coverage: D4,8 = 0.50, p < 0.01).

Distributions of cell density and coverage in forebrain areas with significant reductions in True Blue labeling after lateral hypothalamic lesions. Labeling in stimulated–intact animals (black bars) greater than that in stimulated–lesioned animals (gray bars; two-tailed Kolmogorov–Smirnov tests). Acc, Nucleus accumbens (density: D8,9 = 0.778,p < 0.01); BST, bed nucleus of the stria terminalis (density: D8,9 = 0.556,p < 0.01; coverage:D4,8 = 0.50, p < 0.01);SI/MA, substantia innominata/magnocellular preoptic nucleus (density: D8,9 = 0.528,p < 0.01; coverage:D6,8 = 0.542, p < 0.01). Abbreviations defined in legend to Figure 7.
Marked differences in cell labeling between the two groups also occurred in the SI and in a region including the SI and the magnocellular preoptic nucleus (SI/MA). In both of these areas, many more labeled cells were present in the stimulated–intact animals than in the stimulated–lesioned animals. In the SI, seven of the nine stimulated–intact brains had moderate to dense labeling, whereas none of the stimulated–lesioned brains contained more than scattered cells in this region (D8,9 = 0.778, p< 0.01). In the SI/MA, cell densities and coverage was also significantly greater in stimulated–intact animals than in the stimulated– lesioned subjects (Fig. 9) (density:D8,9 = 0.528, p < 0.01; coverage: D6,8 = 0.542, p < 0.01).
Fiber damage versus cell labeling
The amount of damage done to a projection by the lesions tended to correspond to the degree of cell labeling in that projection’s nucleus of origin. Lesions apparently destroyed most of the MFB compartments containing projections from the nucleus accumbens and from the bed nucleus of the stria terminalis. Correspondingly, both of these nuclei clearly contained fewer labeled cells in the stimulated–lesioned animals than in the stimulated–intact animals. The LH lesions appeared to spare most of the fibers descending medial to the MFB from the lateral septum and the LPO; the distributions of cell densities in the LS and LPO were comparable between the stimulated–intact and stimulated–lesioned groups.
To pursue these apparent correlations, more in-depth quantitative analyses were attempted. The percentage of fibers in each projection eliminated by each lesion were estimated roughly by comparing the boundaries of each lesion at its maximal cross-sectional area with the topographic illustrations of each MFB projection presented at a comparable rostrocaudal level in the Veening atlas (Veening et al., 1982). One-tailed Spearman rank order correlations were then run between these estimates of fiber damage and the amount of cell labeling in the corresponding forebrain nucleus in each animal. These correlations were generally insignificant or negative. In any given animal, we could not predict the pattern of cell labeling in the forebrain from the location of the lesion.
[14C]Deoxyglucose accumulation patterns
In the stimulated–intact rats, electrical stimulation of the ventral tegmental area increased regional metabolic activity in a specific pattern. VTA stimulation increased rostral ipsilateral activity in the fundus of the striatum, the nucleus of the diagonal band, the MPO and LPO, and in a region including the substantia innominata and magnocellular preoptic nucleus. These areas correspond to those activated in previous BSR studies with intact animals and [14C]2-deoxyglucose autoradiography (Yadin et al., 1983; Esposito et al., 1984; Porrino et al., 1984, 1990; Gallistel et al., 1985).
We hypothesized that the LH lesions would transect ipsilateral projections from the VTA to the forebrain, thereby reducing stimulation-induced elevations in [14C]DG accumulation in regions rostral to the lesions. Statistically, in a two-way ANOVA, we expected to find significant stimulation-by-lesion interactions in the forebrain nuclei. In fact, few such effects were observed. Although LH lesions did reduce basal levels of activity in several ipsilateral rostral forebrain sites, VTA stimulation nevertheless increased rostral [14C]DG accumulation in many regions in both the stimulated–lesioned and stimulated–intact groups (Fig.10).

[14C]DG accumulation in forebrain regions ipsilateral to the VTA stimulating electrode. Ipsilateral levels of [14C]DG accumulation were measured with the mean interhemispheric differences ROD of each region. [14C]DG accumulation was compared between intact (▪) and lesioned (○) animals with and without VTA stimulation. Stimulation significantly increased metabolic activity in the ipsilateral nucleus of the diagonal band (NDB), fundus of the striatum (FS), medial and lateral preoptic areas (MPO and LPO). LH lesions significantly decreased ipsilateral activity in the accumbens, NDB, FS, and LPO. Significant stimulation-by-lesion interactions were observed in the NDB, LPO, and substantia innominata/magnocellular preoptic nucleus (SI/MA). For accumbens data, the y-axis was expanded for ease of visualization. Two-way ANOVAs: significant main effect of stimulation: * p < 0.05, **p < 0.01; significant main effect of lesion: §p < 0.05, §§ p < 0.01; significant interaction # p < 0.05, ##p < 0.01.
In the nucleus accumbens, stimulation increased [14C]deoxyglucose accumulation, but this trend did not reach statistical significance. The lesions caused the expected decreases in ipsilateral activity in the accumbens; both stimulated–lesioned and unstimulated–lesioned animals accumulated less [14C]DG in the ipsilateral accumbens than did the intact animals (two-way ANOVA: F(1,21) = 4.93, p < 0.05). No significant interaction of stimulation and lesion was found.
At the septal level, stimulation significantly increased [14C]DG accumulation within the nucleus of the diagonal band, within the fundus of the striatum, and within a border region between the accumbens, substantia innominata, and bed nucleus of the stria terminalis. The lesions also significantly decreased activity in all of the subcortical structures analyzed at this level (significant main effect of stimulation: NDB:F(1,23) = 14.18, p < 0.01; FS:F(1,23) = 6.20, p < 0.05; Acc/SI/BST: F(1,23) = 6.48, p < 0.05. Significant main effect of lesion: NDB:F(1,23) = 19.74, p < 0.01; FS:F(1,23) = 4.75, p < 0.05; Acc/SI/BST: F(1,23) = 18.63, p< 0.01; LS: F(1,23) = 6.64, p< 0.05; MS: F(1,23) = 5.40, p< 0.05; SI: F(1,23) = 12.36, p< 0.01).
A significant stimulation-by-lesion interaction was seen at the septal level only in the nucleus of the diagonal band: within this area, the increase in [14C]DG accumulation in the stimulated–lesioned group was significantly smaller than that in the stimulated–intact group (p < 0.05). Post hoc testing, however, confirmed significantly increased [14C]DG accumulation in the NDB of stimulated–lesioned animals when compared with levels in the unstimulated–lesioned group (t13 = 2.16;p = 0.05); that is, VTA stimulation continued to increase activity significantly in the nucleus of the diagonal band despite the LH lesions. We cannot conclude, then, that the NDB was functionally disconnected from the VTA by the LH lesions.
At the preoptic level, stimulation significantly increased [14C]DG accumulation in the ipsilateral MPO and LPO (MPO: F(1,23) = 5.76, p < 0.05; LPO: F(1,23) = 12.5, p < 0.01). The LH lesion significantly decreased activity in the ipsilateral bed nucleus of the stria terminalis and in the lateral preoptic area (BST: F(1,23) = 8.24,p < 0.01; LPO: F(1,23) = 15.8,p < 0.01). The effect of the lesion apparent in the medial preoptic area did not quite reach statistical significance (F(1,23) = 4.05, p = 0.056). Significant stimulation-by-lesion interactions were observed in the lateral preoptic area and in the region including tissue from the substantia innominata and the magnocellular preoptic nucleus (p < 0.01 for both the LPO and SI/MA). In the stimulated–lesioned animals, VTA stimulation failed to cause the increases in activity seen in stimulated–intact animals in these areas immediately rostral to the lesion. The LH lesions functionally disconnected the stimulation site from the lateral preoptic area and from the substantia innominata/magnocellular preoptic nucleus.
Fiber damage versus regional activity
VTA stimulation continued to generate synaptic activity in many rostral areas despite LH lesions, which apparently eliminated the majority of fibers ascending from the VTA through the MFB. In a given stimulated–lesioned animal, the estimated percentage of VTA fibers damaged did not predict the amount of [14C]DG in most rostral areas.
Relation of connectivity to behavior
Across the True Blue and [14C]deoxyglucose experiments, we assessed four different but related measures of forebrain– midbrain connectivity. As in past experiments, we measured lesion size and analyzed the effects of lesion location. In addition, True Blue and [14C]DG analyses provided direct detailed confirmation of the structural and functional integrity of connections between particular forebrain nuclei and the VTA. However, in most cases, the behavioral effects of a particular LH lesion could not be predicted by any of these measures.
Lesion size
In previously published experiments, animals with elevations of threshold pps tended to have smaller lesions than did animals without threshold elevations. It has been suggested that this effect may be caused by a cancellation phenomenon, whereby larger lesions damage two reciprocal or mutually inhibitory systems and produce a net functional balance (Irle, 1987; Waraczynski, 1988; Murray and Shizgal, 1991). Although small lesions often caused large elevations in threshold pps in our experiments, the size of a given lesion did not predict its behavioral effect (Table 2; Fig. 11). In the True Blue experiment, lesions ranging in maximal cross-sectional area from 0.31 to 1.87 mm2 failed to cause threshold elevations >0.1 log10 unit. No statistically significant rank order correlation was found between lesion size in the stimulated–lesioned True Blue animals and either the threshold shifts at 400 and 800 μA or the current wall. In the [14C]DG experiment, lesions ranging from 0.76 to 1.97 mm2 caused no significant elevations in threshold pps. Moreover, the lesions of the two animals with the largest increases in threshold were widely divergent in size, measuring 0.35 mm2 in DG16 and 2.63 mm2 in DG56. Rank order correlations between lesion size in the [14C]DG animals and the threshold shifts observed at 200, 400, and 800 μA and the current wall did not reach statistical significance (although an inverse trend does appear in Fig.11). Combining data from the True Blue and [14C]DG experiments also failed to reveal statistically significant rank order correlations between lesion size and postlesion shifts in threshold pps at any current or in the current wall.

Lesion size versus postlesion shift in threshold pulse frequency (log10 scale) for stimulated–lesioned animals in the True Blue (TB) and [14C]deoxyglucose (DG) experiments. Lesions were measured at their maximum cross-sectional area. Shifts in threshold pulse frequency were measured at 200 μA (○), 400 μA (shaded triangle), and 800 μA (▪). Postlesion shifts in current wall (■) are also plotted.Horizontal shading highlights the range between −0.1 and 0.1 log10 units.
Lesion location
Correlations between the estimated damage to individual MFB projections and postlesion shifts in threshold pps and/or the current wall rarely reached statistical significance and, when significant, were negative.
True Blue labeling
With one exception, the behavioral effect of a given LH lesion did not appear to depend on the extent to which individual forebrain nuclei remained structurally connected to the VTA after the lesion. No statistically significant rank order correlations between cell density and shift in threshold pps were found in any of the forebrain regions. Rank order correlations between regional cell coverage and shift in threshold pps revealed only one statistically significant correlation: animals with less cell coverage in the LPO had greater postlesion elevations in threshold pps (800 μA: rs8 = −0.75, p < 0.025; current wall:rs8 = −0.75, p < 0.025).
[14C]deoxyglucose accumulation
The amount of postlesion synaptic activity in most forebrain regions also failed to predict the magnitude of the postlesion threshold shifts. Only one significant correlation between regional relative optical densities and shifts in threshold pps was found. Animals with larger amounts of [14C]DG in the SI/MA had significantly greater elevations of their current wall (r9 = 0.73, p < 0.05). This correlation is in the opposite direction of that expected if synaptic activity in the SI/MA were critical for brain stimulation reward.
DISCUSSION
Despite abundant evidence from psychophysical, electrophysiological, pharmacological, and autoradiographic experiments that the fibers mediating BSR are concentrated in the MFB, studies with rostral MFB lesions have invariably included some subjects with little or no reduction in rewarding efficacy. Histological descriptions of lesion size and location have not sufficed to account for these between-animal differences in the magnitude of behaviorally measured effects.
In these experiments, we attempted to identify damage unique to animals with postlesion decreases in rewarding efficacy by pursuing a more detailed investigation of the structural and functional effects of these lesions. We have provided the first direct evidence that specific forebrain nuclei remain structurally and functionally connected to the midbrain after MFB lesions. Conversely, we have directly identified midbrain–forebrain connections lost after LH lesions. These results suggest which projection systems are more or less likely to mediate the rewarding effects of MFB stimulation. Despite this new information, in most cases, the patterns of retained midbrain–forebrain connectivity could not predict the effects of a particular lesion on an individual animal’s postlesion reward thresholds.
Lateral hypothalamic lesions and rewarding efficacy
As in previous experiments with lesions made rostral to an MFB stimulating electrode, the behavioral effects of the LH lesions varied widely (Stellar and Neely, 1982; Colle and Wise, 1987; Janas and Stellar, 1987; Waraczynski, 1988; Murray and Shizgal, 1991, 1996b;Arvanitogiannis et al., 1996b; Gallistel et al., 1996). Approximately half of the stimulated–lesioned animals showed no postlesion increases in threshold pps. On the other hand, contrary to an earlier report from this laboratory (Gallistel et al., 1996), rostral MFB lesions clearly can reduce the rewarding efficacy of VTA stimulation. One-third of the animals in this group demonstrated some of the largest postlesion reductions in rewarding efficacy ever reported (cf. Arvanitogiannis et al., 1996b; Murray and Shizgal, 1996b). In the remaining stimulated– lesioned animals, lesions caused intermediate effects. Threshold pulse frequencies in some stimulated–intact animals decreased over time, and the lesion effects may have been superimposed on a similar trend in the stimulated–lesioned animals. Therefore, we may have underestimated the magnitude of the postlesion reductions in rewarding efficacy in some cases. However, we obtained a range of threshold shifts very similar to those reported previously. Our goal was to provide additional anatomical data to explain this range.
Basic histological analyses failed to reveal why some lesions substantially affected brain stimulation reward and others did not. Lesions that reduced rewarding efficacy tended to be smaller on cross-section, but we could not predict the effect of a lesion based on its size. Although our estimates of damage to particular MFB projection systems were necessarily rough, if damage to a particular MFB compartment had resulted in a consistent reduction in rewarding efficacy, our qualitative and quantitative analyses should have uncovered this correlation. No such correlation emerged. The size and location of those rostral MFB lesions that raise thresholds and those that have little effect on brain stimulation reward overlapped in our experiments, as they have in previously published work (Waraczynski, 1988; Murray and Shizgal, 1991; Arvanitogiannis et al., 1996b; Murray and Shizgal, 1996b).
It has been suggested that variability in the effects of rostral lesions on rewarding efficacy results from inaccurate assumptions of the “counter” model, in which the expected postlesion elevation in threshold pulse frequency is proportional to the amount of damage to the relevant population of fibers (Gallistel et al., 1981). More complex models have been proposed in which multiple counters allow the loss of large numbers of reward relevant fibers from the field of stimulation without causing large increases in the amount of required stimulation (Arvanitogiannis et al., 1996b). Although the multiple-counter model, in principle, could account for some of the puzzling between-subject variability, this model has yet to be tested directly. Compelling empirical data in support of a new, more complex model are required before rejecting the more parsimonious single-counter model.
We approached this problem of variability by testing another assumption. We asked whether rostral MFB lesions in fact do consistently reduce the number of connections between forebrain nuclei and the site of stimulation.
True Blue labeling patterns and rewarding efficacy
Our labeling data show that extensive structural connections often remain between stimulation sites in the VTA and major rostral nuclei despite extensive disruption of the MFB. Even in animals with large MFB lesions, True Blue was still retrogradely transported from fibers of passage at the VTA electrode to cell bodies in the infralimbic area, the nucleus of the diagonal band, the septal complex, and the medial and lateral preoptic areas. Within the limits of the anatomical analyses used, the density and regional coverage of labeled cells in these areas could not distinguish an individual in the stimulated–lesioned group from one in the stimulated–intact group.
Having remained anatomically connected to the VTA, neurons in these septal and preoptic nuclei could have provided an intact substrate for brain stimulation reward despite the LH lesions. The lateral preoptic area has been proposed as an important site of origin for reward fibers in the MFB (Yeomans, 1982; Shizgal et al., 1989; Stellar, 1990;Arvanitogiannis et al., 1996a,b; Hunt and McGregor, 1998). The fact that large MFB lesions between the LPO and the stimulation site frequently fail to elevate BSR thresholds might be considered evidence against this hypothesis, but our True Blue data show that the projection from the LPO to the VTA usually remains intact despite such lesions. Further supporting the hypothesis that LPO projections play a critical role in BSR, stimulated–lesioned animals with a smaller proportion of the LPO covered by labeled cells had greater postlesion elevations in threshold pps.
Our labeling data show that LH lesions did consistently disconnect some forebrain regions from the VTA. In all of the stimulated–lesioned animals, cell labeling was reduced in the nucleus accumbens and fundus of the striatum, in the substantia innominata and magnocellular preoptic nucleus, and in the bed nucleus of the stria terminalis. These areas have previously been hypothesized to contain cell bodies of the axons that mediate the rewarding effects of MFB stimulation (Arvanitogiannis et al., 1996b; Murray and Shizgal, 1996a,b; Flores et al., 1997). However, the reduction of cell labeling in these regions did not correlate with postlesion shifts in reward efficacy. At face value, these data imply that descending fibers from the ventral striatum, from the magnocellular nuclei of the basal forebrain, and from the bed nucleus of the stria terminalis are not necessary for brain stimulation reward.
We chose True Blue to assess the anatomical connectivity of forebrain nuclei to the midbrain stimulation site for two reasons. Most importantly, True Blue is one of few retrograde tracers taken up by fibers of passage. In addition, crystal True Blue can be implanted directly at the stimulating electrode tip, and diffusion of the crystal from its site of deposition is limited. Therefore, by using True Blue crystals, we maximized the likelihood that the stimulated neurons would also become labeled. One limitation with this approach, however, is that variation in dye placement contributes to variation in the labeling patterns; on an individual-by-individual basis, the absence of True Blue label in a particular area could result either from a variation in dye uptake or from disconnection by the lesion. Also, True Blue labeling is not limited to stimulated fibers, much less to fibers critical to brain stimulation reward. Future self-stimulation experiments that combine True Blue with c-fos immunohistochemistry, which highlights cells activated directly or indirectly by the stimulation, may provide complementary information allowing more precise identification of the cells critical for BSR.
[14C]Deoxyglucose accumulation and rewarding efficacy
Although our lesions generally destroyed the portion of the MFB activated in our stimulated–intact subjects, many rostral areas nevertheless remained functionally connected to the VTA. In the stimulated–lesioned group, VTA stimulation still caused significant ipsilateral increases in [14C]DG accumulation in the fundus of the striatum, the nucleus of the diagonal band, the border region between the accumbens, substantia innominata, and bed nucleus of the stria terminalis, and the medial preoptic area. Any of these still-activated regions may have contained synaptic terminals critical to the reward circuit.
Only two ipsilateral forebrain areas failed to show the usual stimulation-induced increases in activity after the LH lesions. A significant stimulation-by-lesion interaction was found in the LPO and in the region including SI/MA. However, the level of [14C]DG accumulation in the LPO did not predict the size of the postlesion threshold shift, suggesting that this nucleus does not contain synaptic terminals necessary for BSR. In the SI/MA, [14C]DG accumulation was directly correlated to the postlesion shift in the current wall; that is, the greater the activity in the SI/MA, the greater the current wall elevation. Therefore, synaptic activity in the SI/MA is even less likely to play a critical role in BSR.
We chose to use [14C]DG autoradiography to assess the functional connectivity of the VTA site of stimulation to forebrain nuclei after LH lesions because [14C]DG autoradiography had been shown to be a robust and reliable marker of activity in previous BSR experiments (Yadin et al., 1983; Esposito et al., 1984; Porrino et al., 1984, 1990; Gallistel et al., 1985). In addition, with [14C]DG, one has the ability to visualize areas activated trans-synaptically as well as directly. This allows one to map an entire functional pathway and, potentially, to observe the point at which a lesion disrupts such a pathway. This methodological benefit of [14C]DG autoradiography remains one of its limitations: one cannot state that activation in any particular area resulted directly from the stimulation. For example, the rostral activation evident in stimulated–lesioned animals may have resulted from the stimulation of a multi-synaptic pathway, such as the dorsal diencephalic conduction system, which bypasses the damaged MFB entirely (Olds et al., 1960; Sutherland, 1982). [14C]DG autoradiography also has limited resolution, demonstrating changes in activity on a regional rather than a cellular level (Sharp et al., 1993). Recently, c-fos immunohistochemistry has been shown to visualize individual neuronal somata activated after brain stimulation reward, but we encountered technical difficulties in our own attempts to combine this method with [14C]DG autoradiography (cf. Arvanitogiannis et al., 1996a, 1997; Flores et al., 1997; Panagis et al., 1997; Hunt and McGregor, 1998).
Mesolimbic projections and brain stimulation reward
Pharmacological experiments have emphasized the importance of the dopaminergic mesolimbic projections in brain stimulation reward. If activity at dopaminergic synapses in the ventral striatum were critical to the rewarding efficacy of VTA stimulation, then [14C]DG should have accumulated within the nucleus accumbens and/or fundus of the striatum in any self-stimulating animal. The effects of VTA stimulation on activity in the accumbens has been a matter of some debate (Yadin et al., 1983; Esposito et al., 1984;Porrino et al., 1984, 1990; Gallistel et al., 1985). Although this study was not designed to examine this question directly, significant increases in [14C]DG accumulation were not observed in the nucleus accumbens in the stimulated–intact group. However, stimulation did increase activity in the FS. This activity remained present in the animals with LH lesions and could have been involved in mediating the rewarding effects of brain stimulation.
Although the accumulation of [14C]deoxyglucose in the fundus of the striatum could be attributable to activity at dopaminergic terminals, [14C]DG autoradiography cannot identify specific synapses or neurotransmitters. Moreover, the effectiveness of the stimulation did not depend on activity in the ventral striatum in this experiment: there were no statistically significant inverse correlations between levels of [14C]DG accumulation in the accumbens or FS and the magnitude of postlesion threshold shifts at any current. Therefore, this experiment provides weak evidence at best for the role of dopaminergic projections in BSR. Future experiments might combine lesions, pharmacological treatments, and in vivomicrodialysis to clarify whether dopamine release in the ventral striatum in fact is necessary for brain stimulation reward (Phillips et al.,1989, 1992; Miliaressis et al., 1991).
Conclusions
In the search for the neural substrate of brain stimulation reward, forebrain nuclei have been hypothesized to contain either the cell bodies or the terminals of MFB projections critical to BSR. Disconnection of the forebrain nuclei from a rewarding stimulation site should then reduce the rewarding efficacy of stimulation. In the presented experiments, we directly examined the assumption that rostral MFB lesions disconnect forebrain nuclei from a VTA stimulation site.
We found that we could not distinguish stimulated–intact from stimulated–lesioned animals based on the patterns of True Blue labeling or on the patterns of regional metabolic activity in many forebrain nuclei. Moreover, except for a significant inverse correlation between cell coverage in the LPO and postlesion threshold pulse frequency, we could not predict the behavioral effects of a lesion from any of our independent measures of forebrain–midbrain connectivity.
Our study provides the first definitive evidence that many forebrain areas remain anatomically and functionally connected to a VTA stimulation site after an MFB lesion at the level of the lateral hypothalamus. Our results suggest that the medial forebrain bundle is more like a net than a cable. Axons in the MFB may be collateralized in such a way that destruction of an intervening portion of the tissue does not commensurately reduce the connectivity between two points on either side of the destruction. The highly collateralized brainstem neurons described by Magni and Willis (1963), Scheibel and Scheibel (1958), and Valverde (1961) could create such a netlike pattern of connectivity.
Most strongly, these results demonstrate that continued attempts to identify the MFB neurons critical to BSR require a firmer anatomical foundation. Although psychophysical techniques allow us to quantify reliably the behavioral effects of our lesions in individual animals, currently available techniques do not provide us with parallel anatomical capabilities. We lack a single technique to measure the extent of connectivity both before and after a lesion. Therefore, we are unable to obtain a direct measure of the damage done to a particular connection in an individual subject. Rather, our anatomical analyses are limited to between-group comparisons; as such, these analyses are necessarily burdened with many extra sources of variability. Such noise in the data may have obscured true correlations between postlesion connectivity and postlesion behavior. Further elucidation of these issues will hinge on the development of methods for producing reliable, quantifiable damage to specific MFB projections and for visualizing the anatomical and functional effects of such lesions in individual animals.
Footnotes
J.S. was supported by National Institutes of Health Medical Scientist Training Program Grant GM08042. This work is based on a dissertation submitted by J.M.S. in partial satisfaction of the requirements for the Doctor of Philosophy degree in Neuroscience (with the greatest appreciation for the intelligence and wit of the dissertation committee members: Joaquin Fuster, Frank Krasne, and Larry Kruger).
Correspondence should be addressed to Dr. Simmons at her present address: Western Psychiatric Institute and Clinic, 3811 O’Hara Street, Pittsburgh, PA 15213.
Dr. Ackerman’s present address: Department of Psychiatry and Behavioral Neurobiology, University of Alabama School of Medicine, Birmingham, AL 35294.


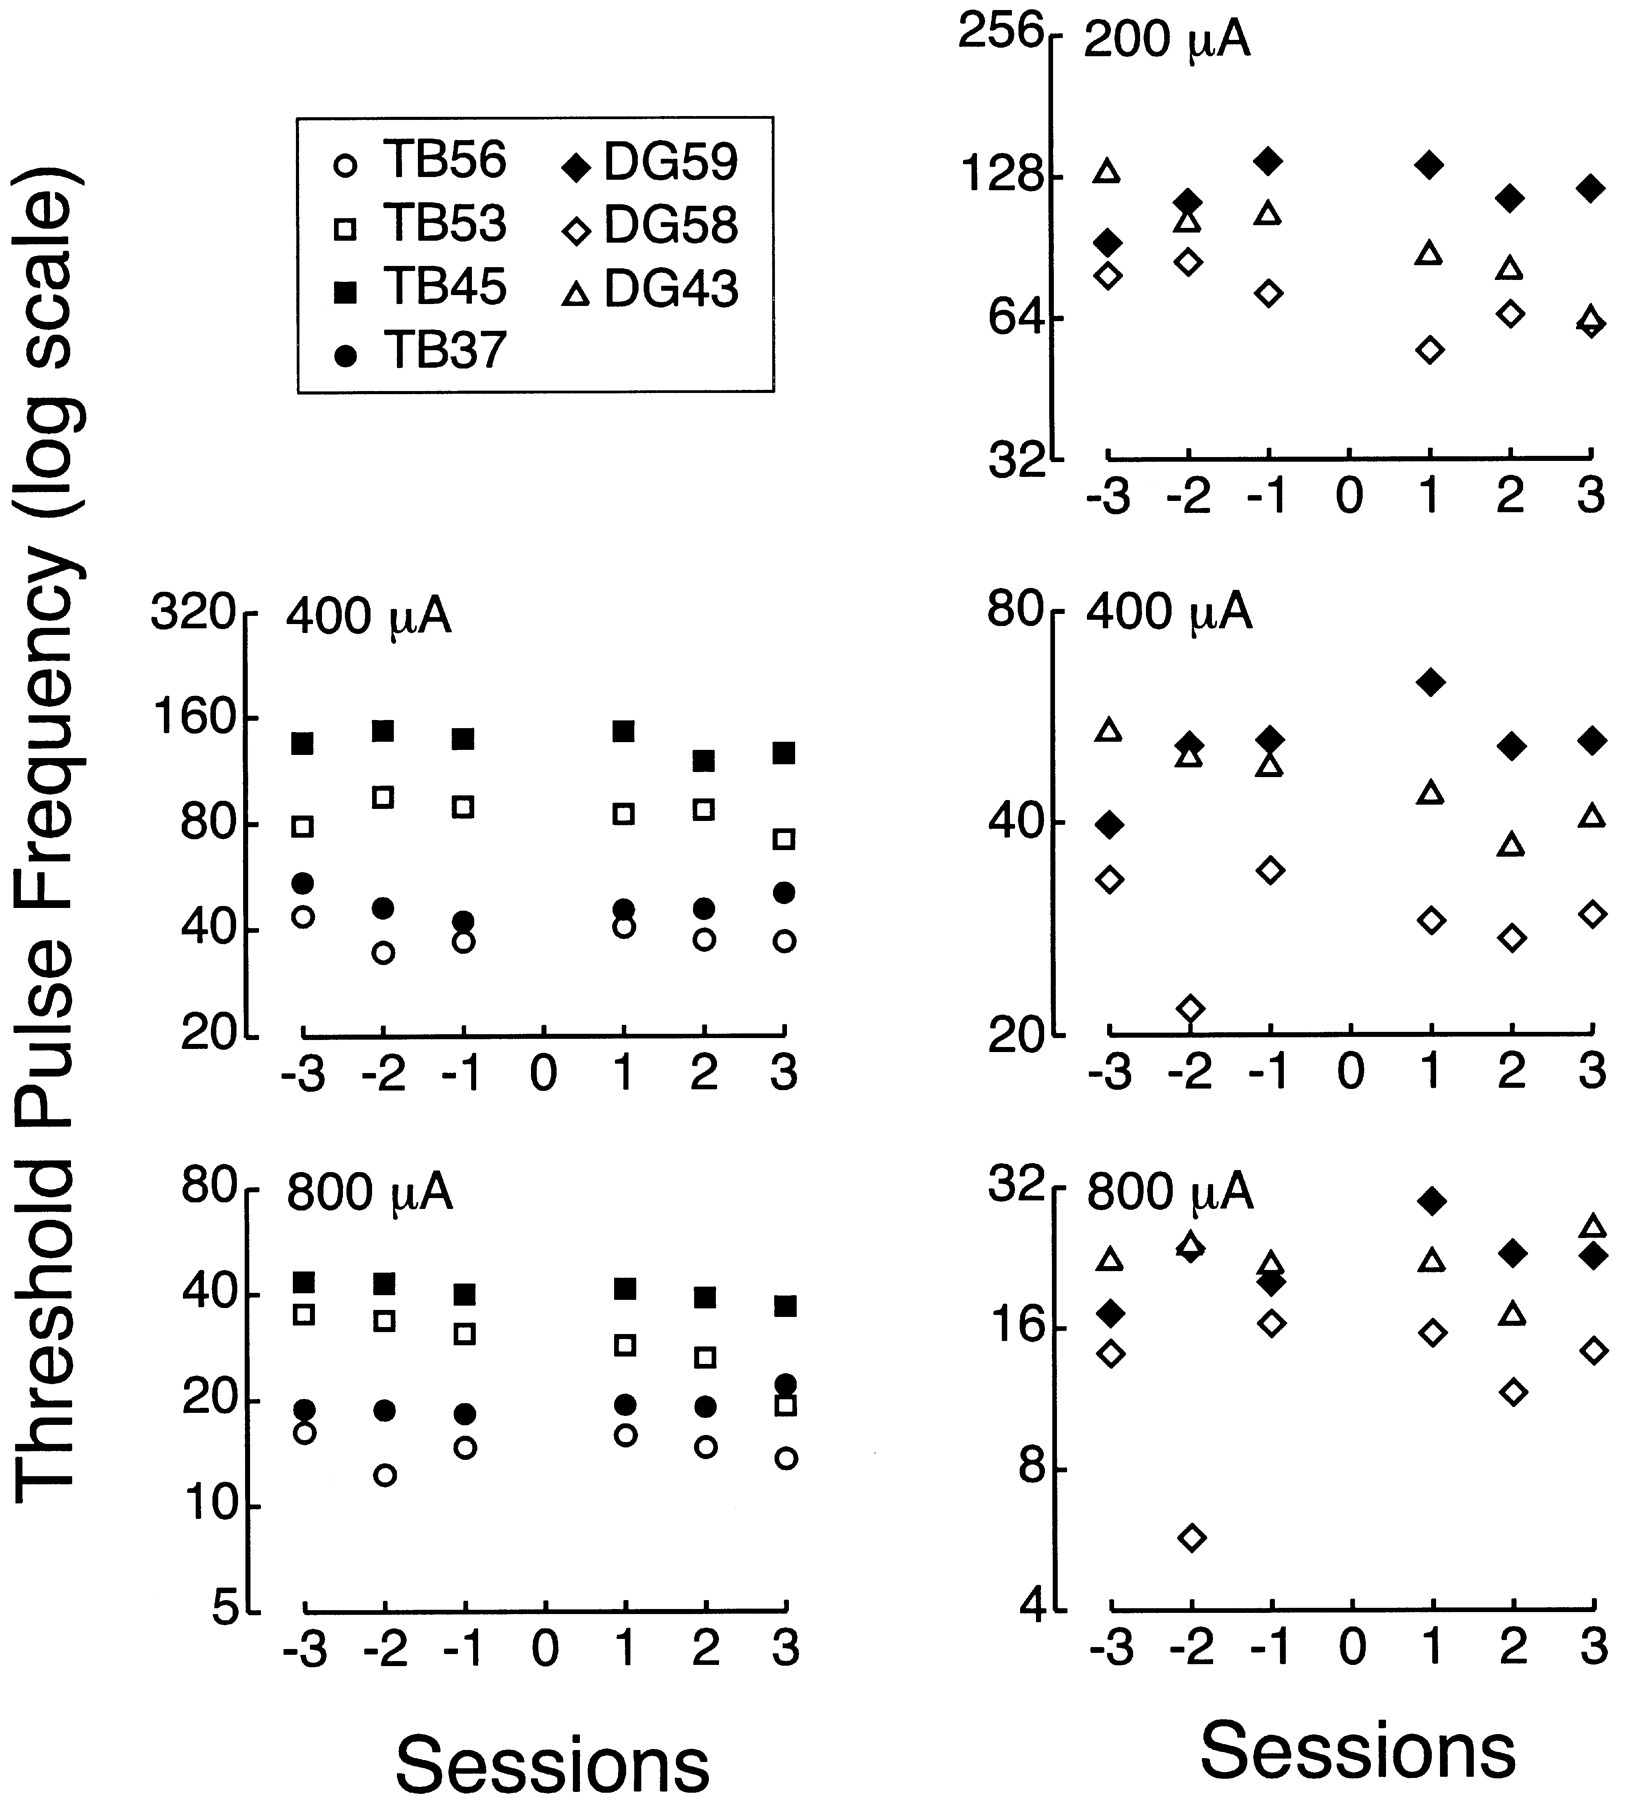